
2024 Projects
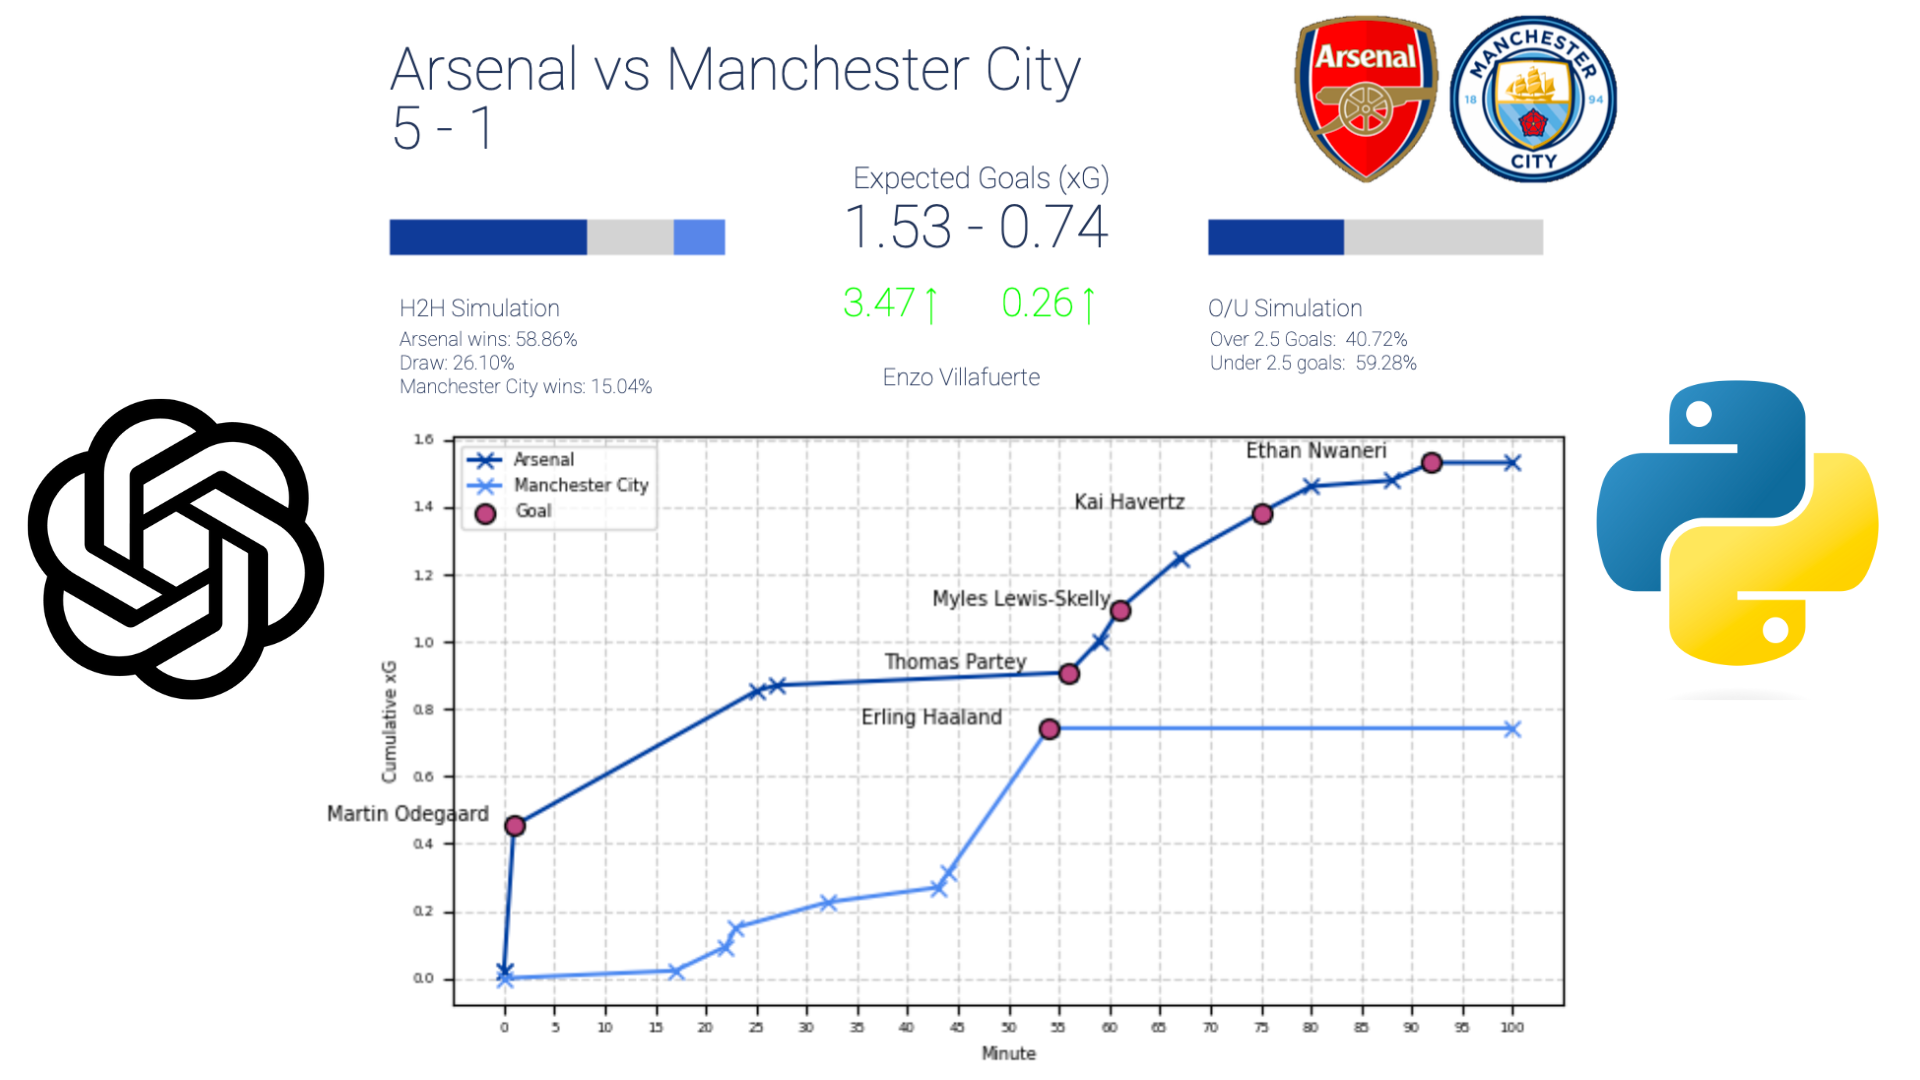
Montecarlo xG Analysis with LLM Integration
Scrapes game xG data from Understat and runs Monte Carlo simulations to estimate win probabilities for each team. Additionally, generates an xG flowchart to visualize team xG momentum throughout the game. The output of the simulations is then pass over to open ai API for analysis retrieval based on that input.
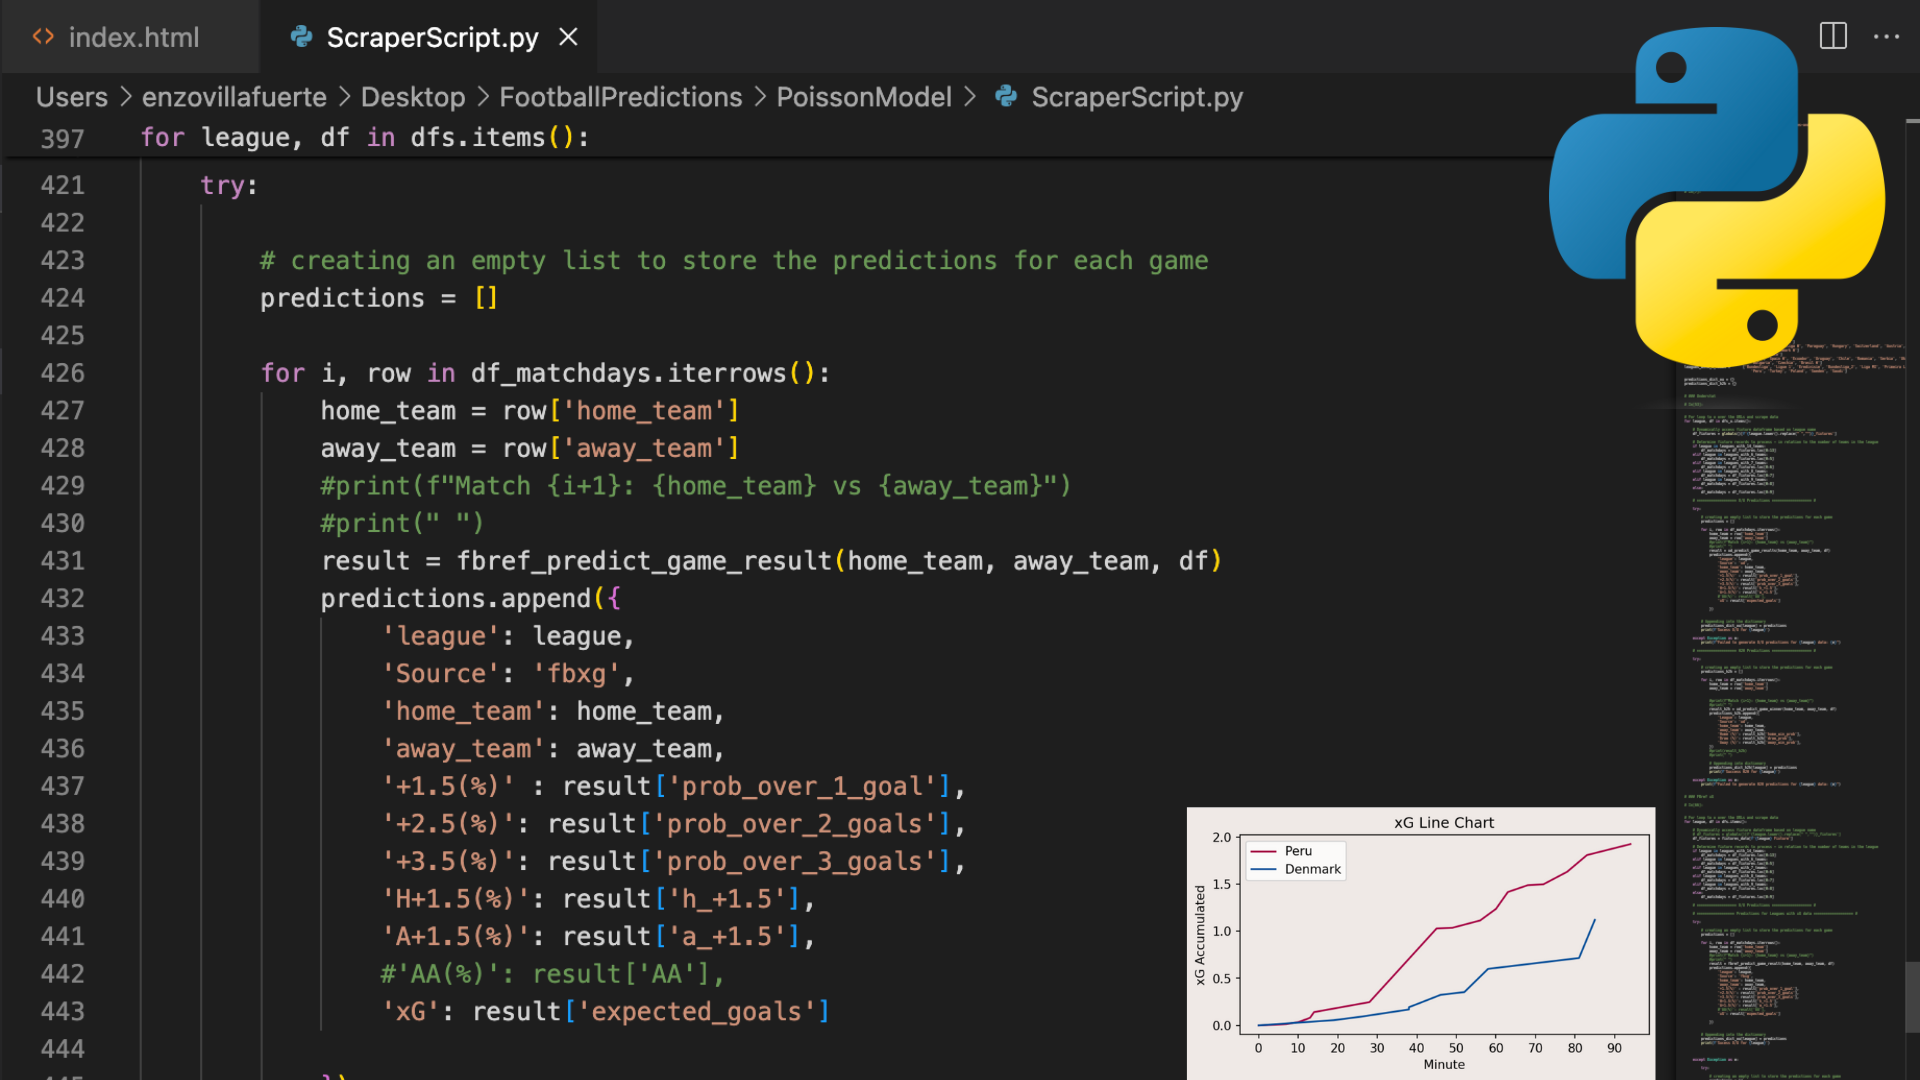
Football Predictor V2.0
Program that scrapes and processes expected goals (xG) data from multiple data sources (FBRef.com & Understat.com) to cover 40+ football leagues in the world predicting the outcome of each game using a model rooted in the Poisson Distribution. The pipeline was then automated and scheduled to run twice a week. Perfect for making some extra $$
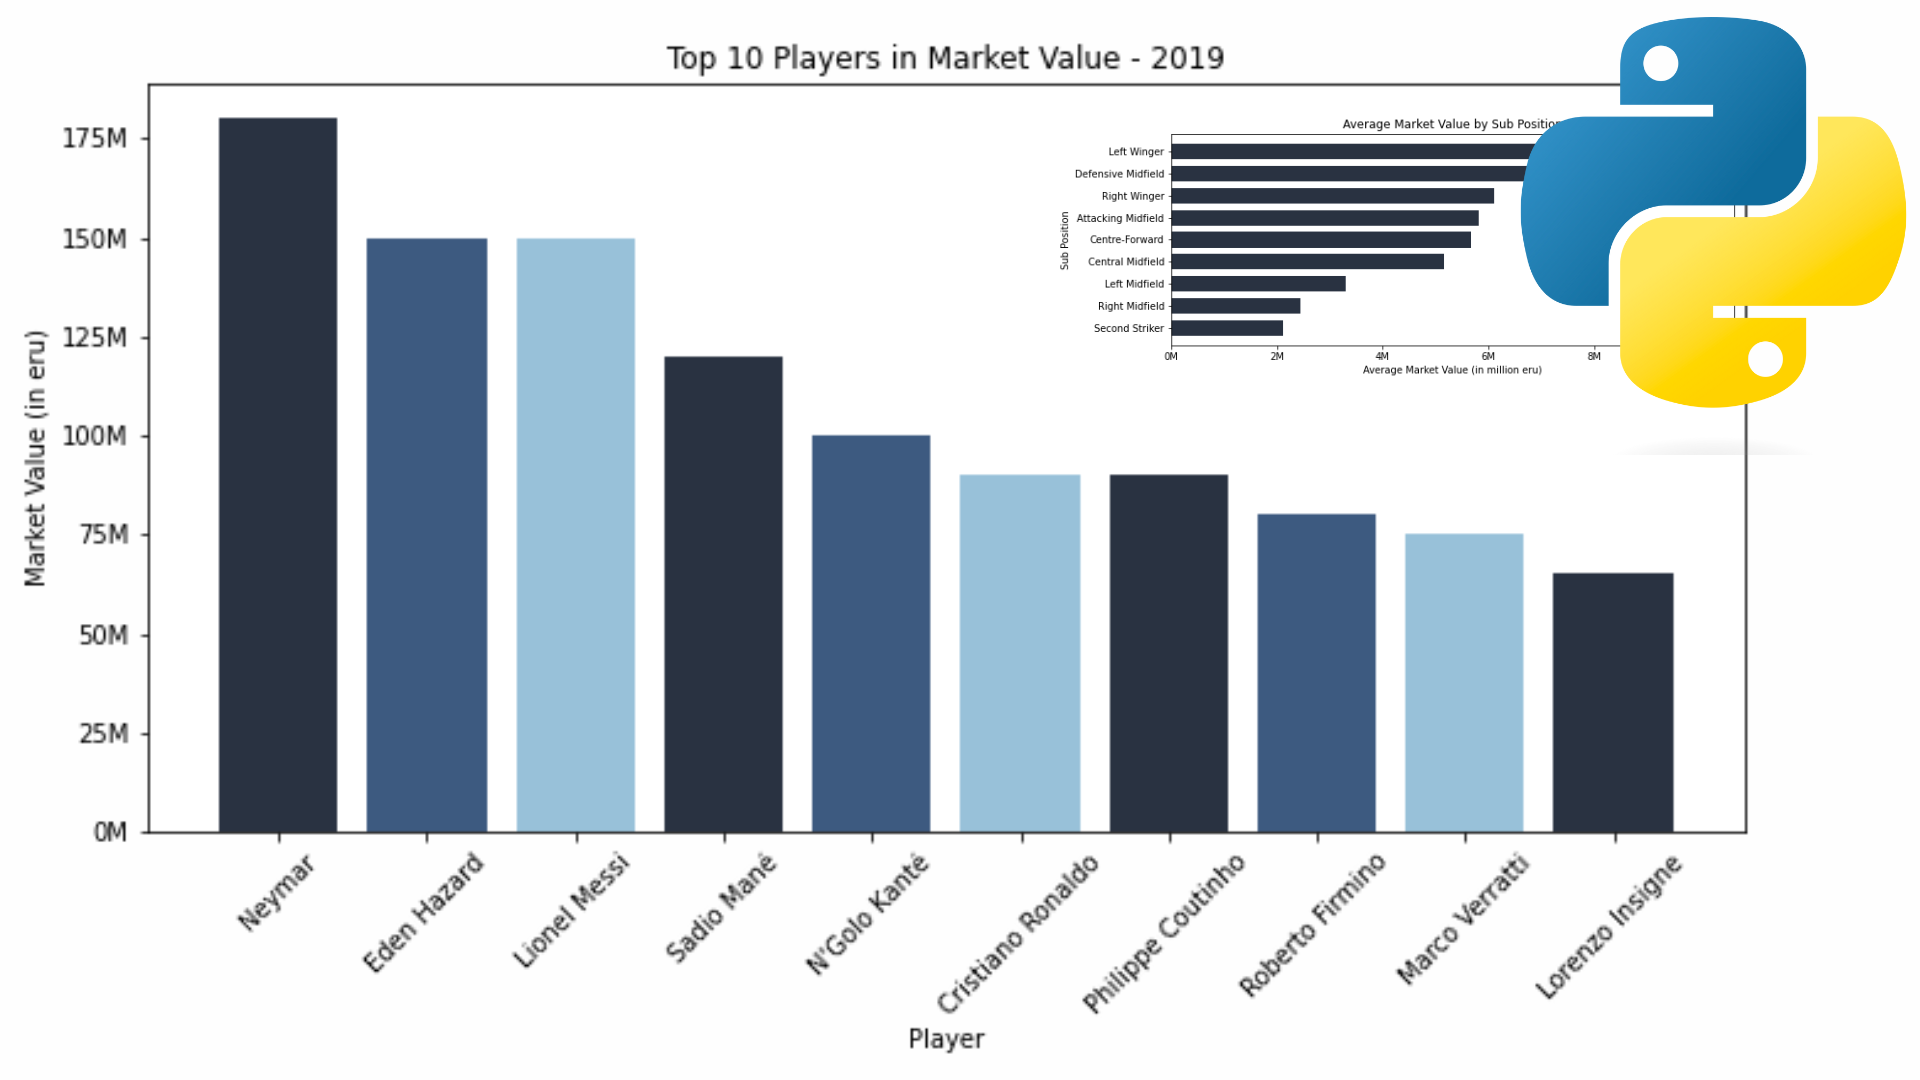
Predicting Market Value
Project analyzing four seasons of historical player values from Transfermarkt, combined with on-field performance data. Conducted data analysis to identify patterns and trends, and applied machine learning models such as Ridge Regression, Random Forest, k-NN, and Neural Networks to predict player values based on performance metrics.
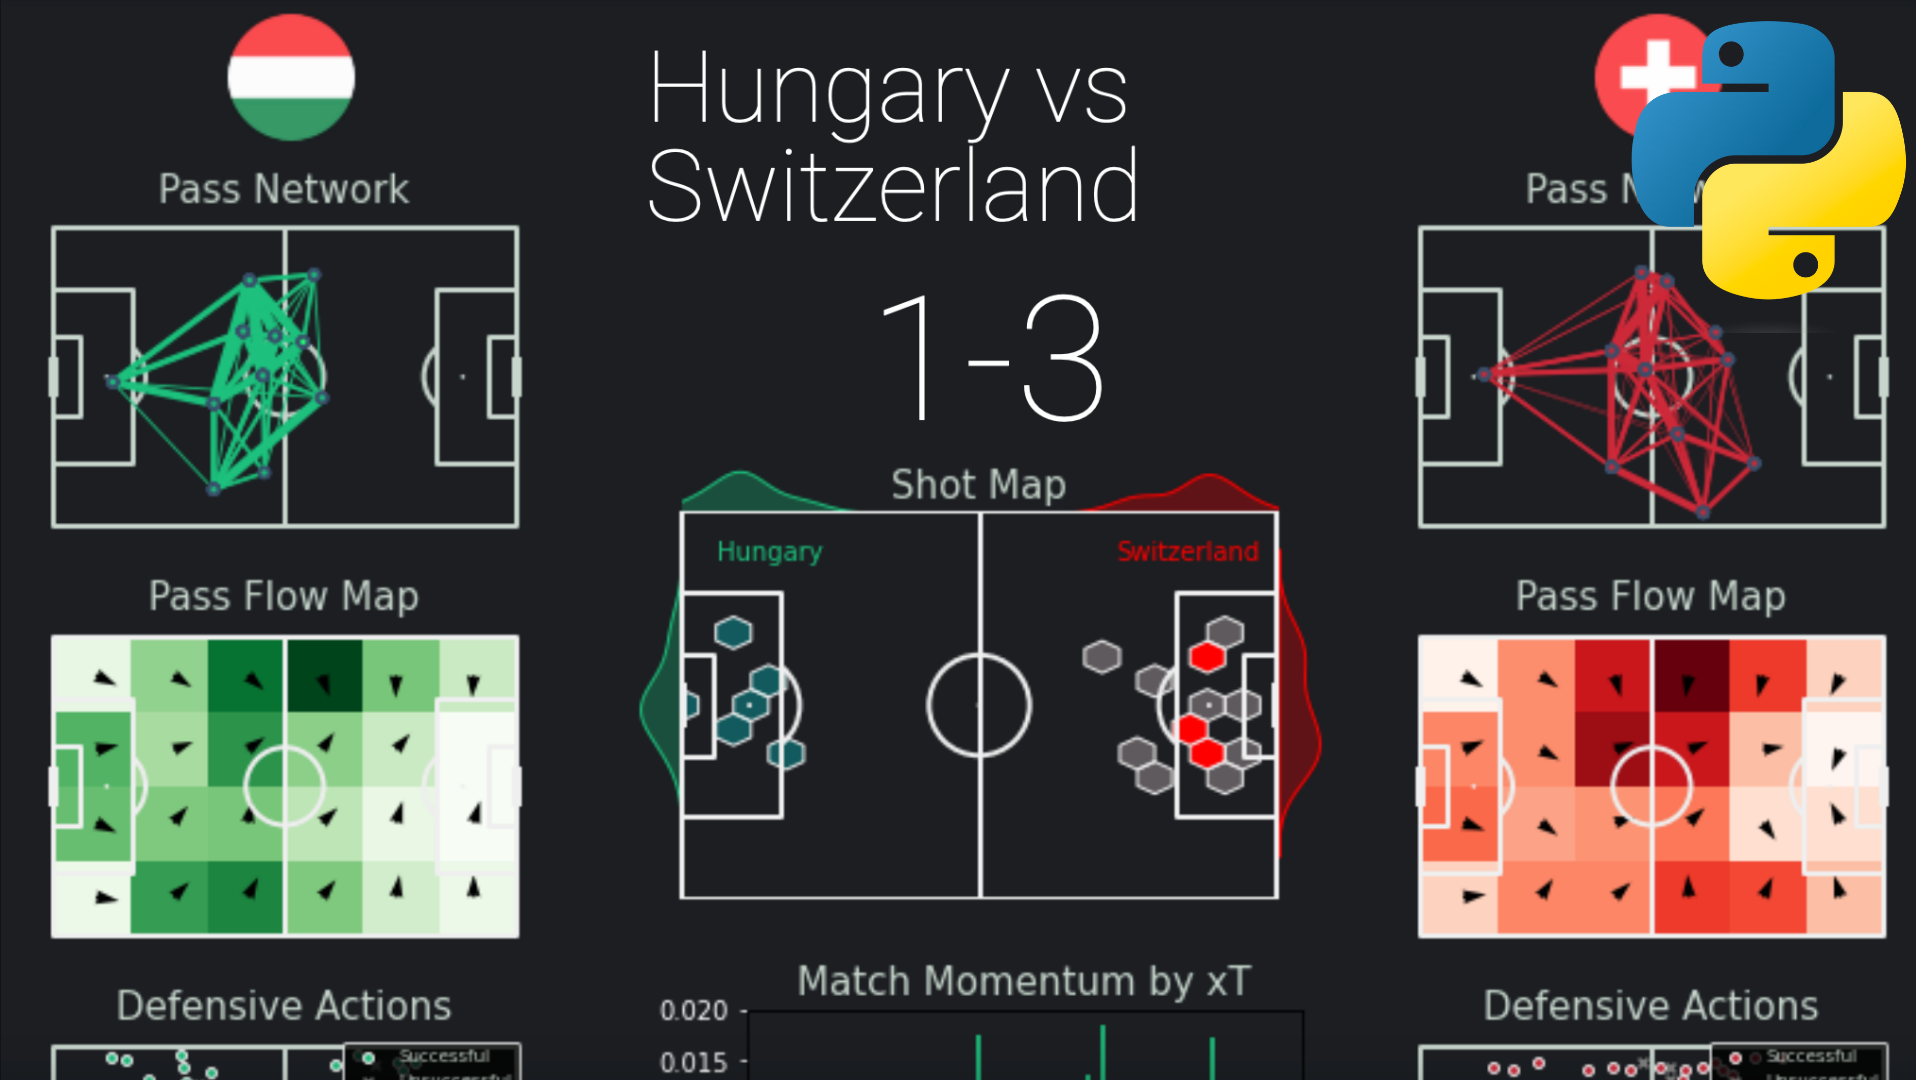
Euros 2024 Automated Report
Automated Web Scrapping pipeline that receives a user URL as input and extracts advanced events data in JSON format for the specific game from whoscored.com. It then processes and generates a PDF performance report to assess and contrast pass network dynamics, pass, shots & actions analysis, match momentum, etc.
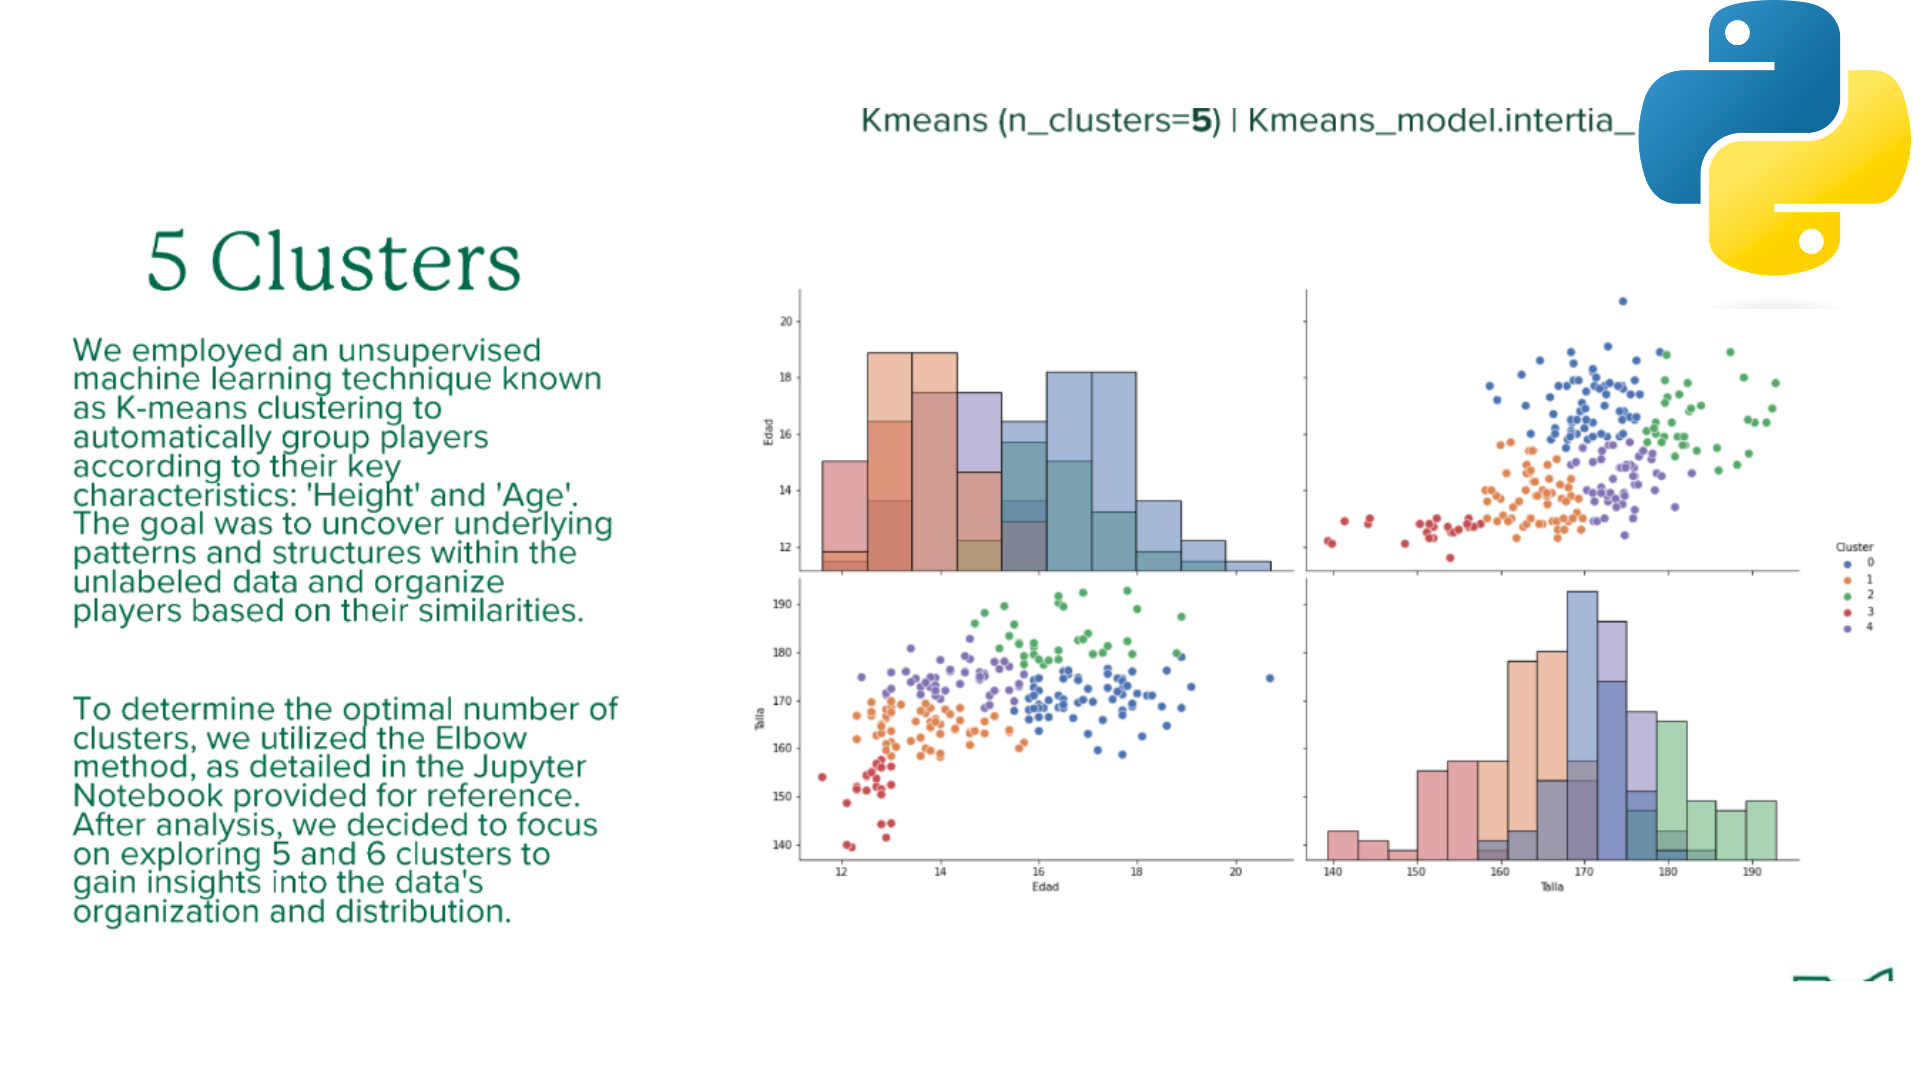
Player Grouping with K-Means
Partnered with Club Sporting Cristal to implement K-means clustering, improving the grouping of academy players based on their biological characteristics (Height and Age) rather than their player category (U15, U16, etc.) , leading to more accurate evaluation and assessment of their anthropometric data and the creation of new reference values.
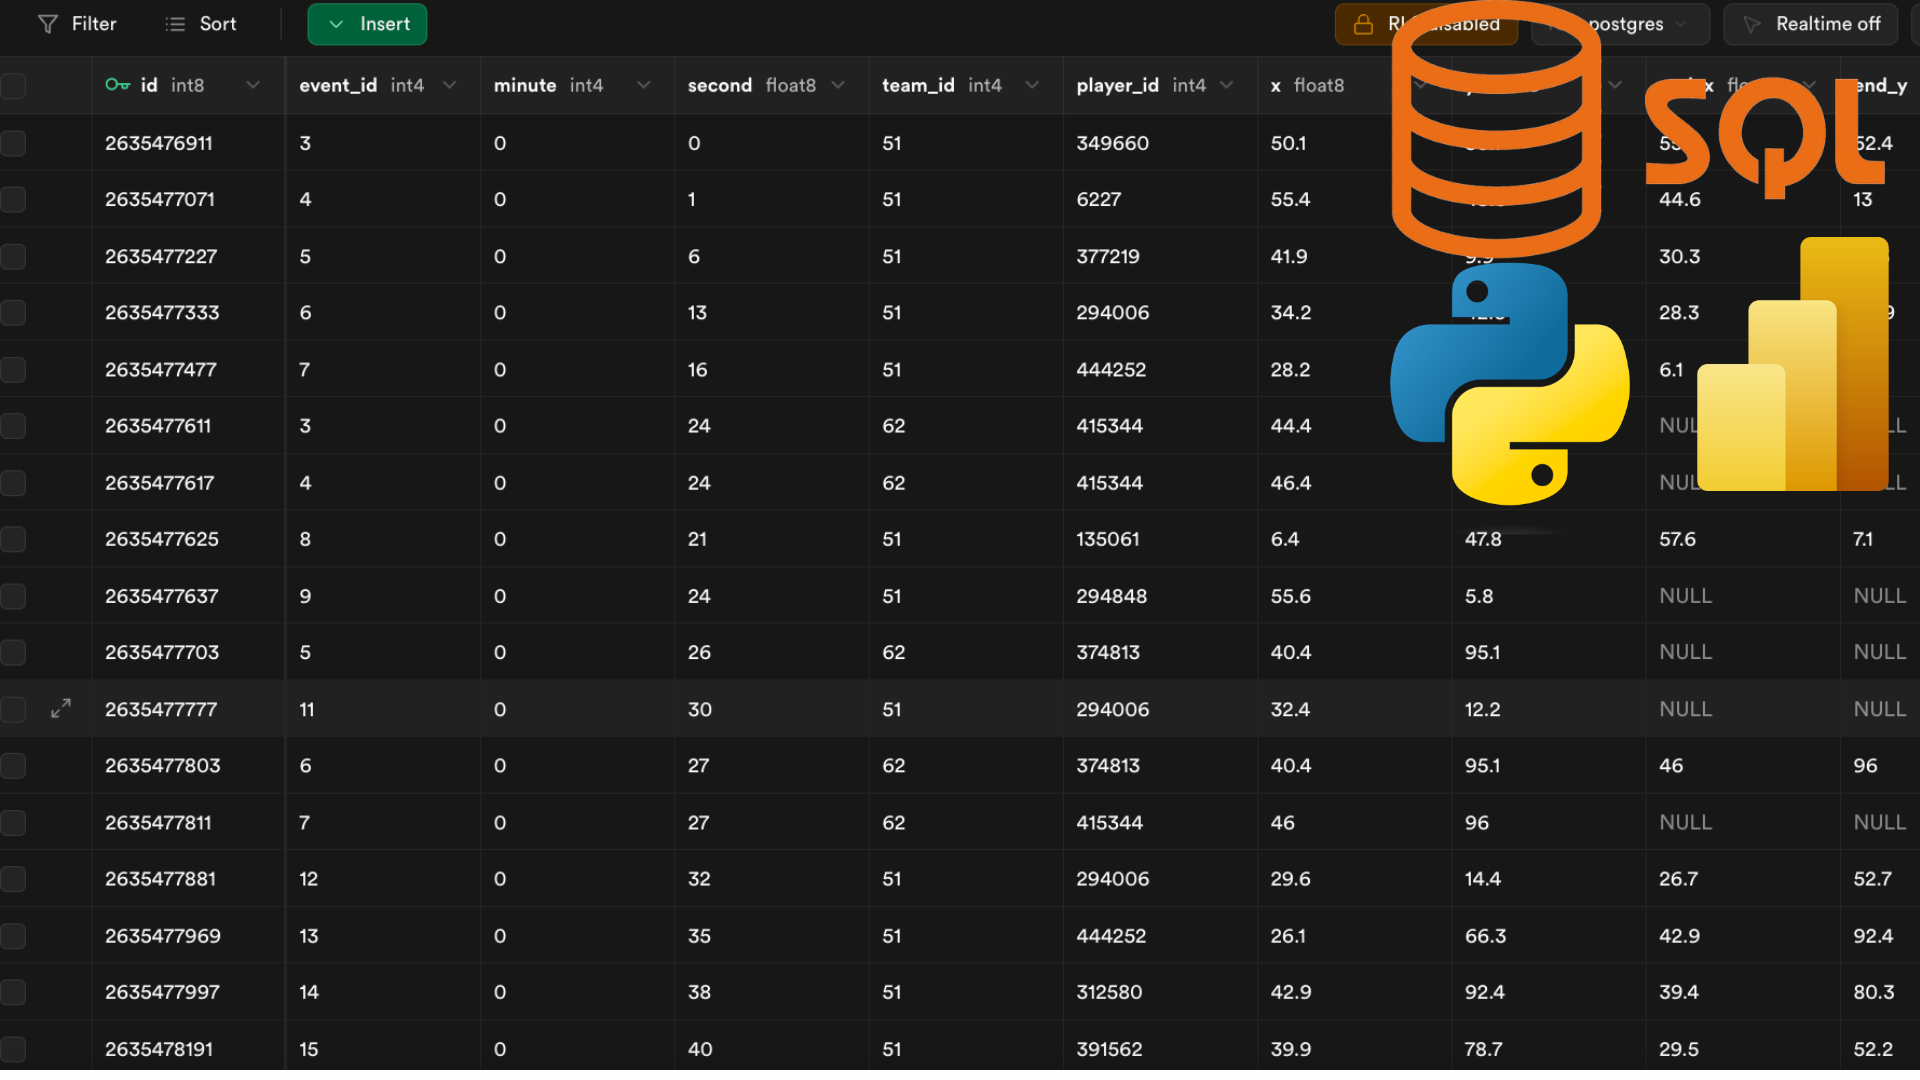
(In Progress) Cloud ETL Pipeline for Goal Analysis
The goal is to store the output of FootballModelV3.0 in a data warehousing system, allowing for later analysis and descriptive statistics on model performance with various filters, such as leagues or team characteristics. This involves data modeling, cloud integration with PostgreSQL, and Power BI reporting.

Montecarlo Simulation & Football
R script used for MonteCarlo Simulation to predict game outcomes based on shot event data of a game, including shots taken, expected goals (xG), and actual goals scored. Probabilistic analysis of various scenarios.
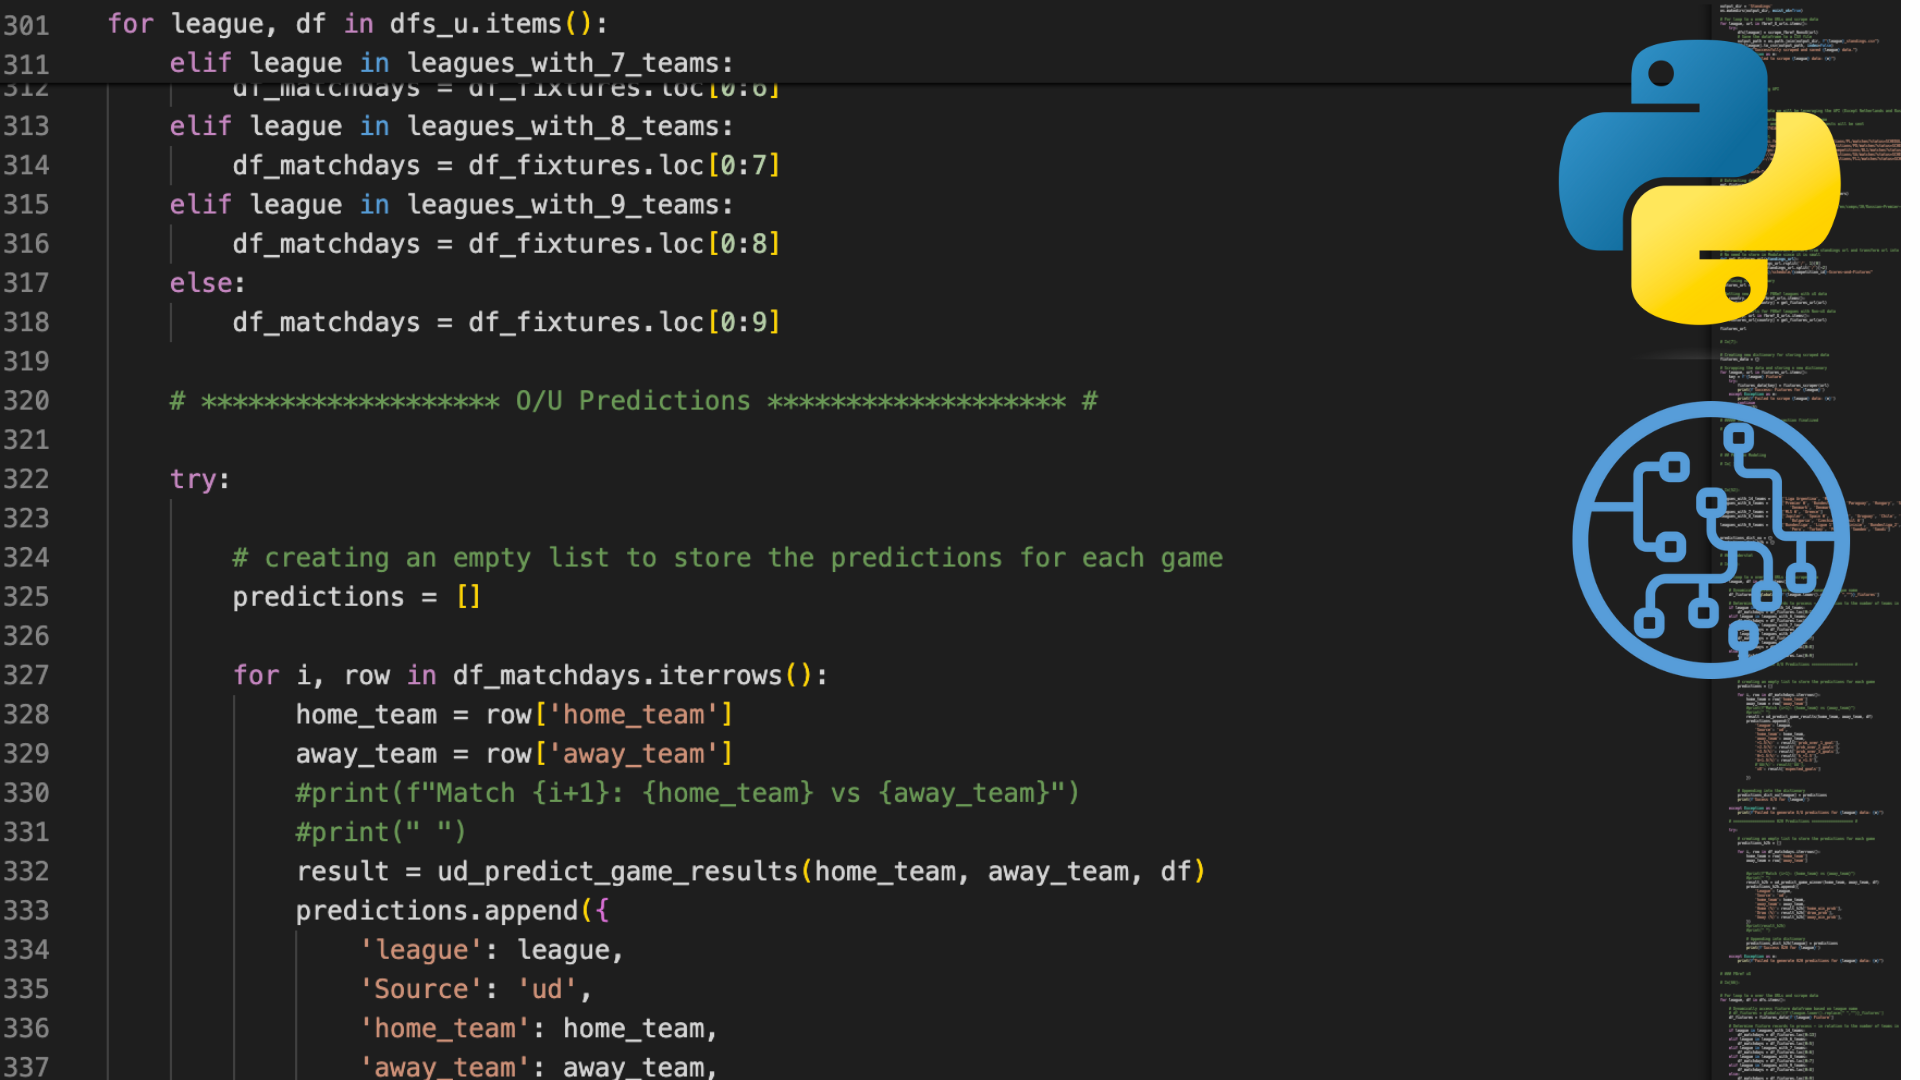
(In progress) ML Football Predictor V3.0
Building on V2.0, this version expands beyond xG data by engineering pipelines to extract various game metrics. These metrics will be used in machine learning models to predict whether games will have + 2.5 goals.
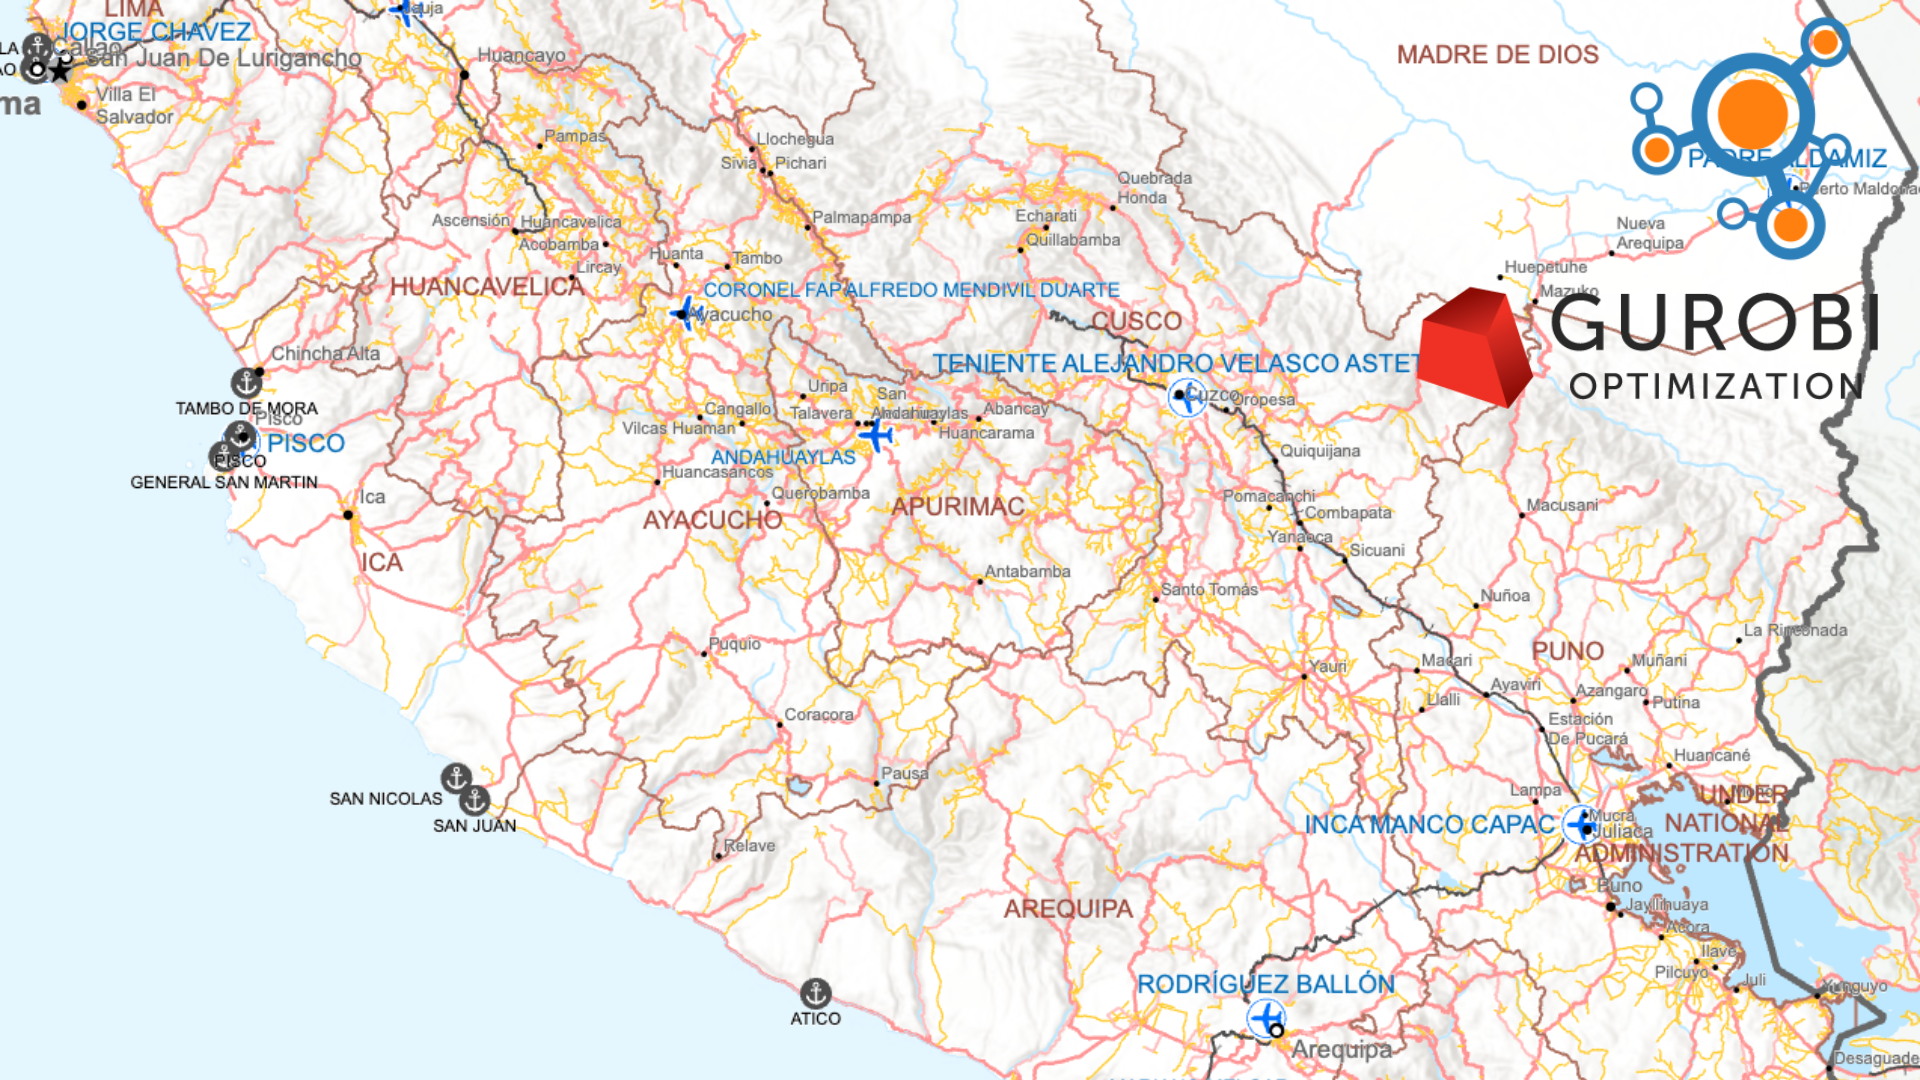
Network Resilience Analysis - Cusco
Project using Network Science to evaluate the connectivity of the transportation network during disaster-response operations after a potnetial catastrophic event in Cusco, Peru.
2023 Projects
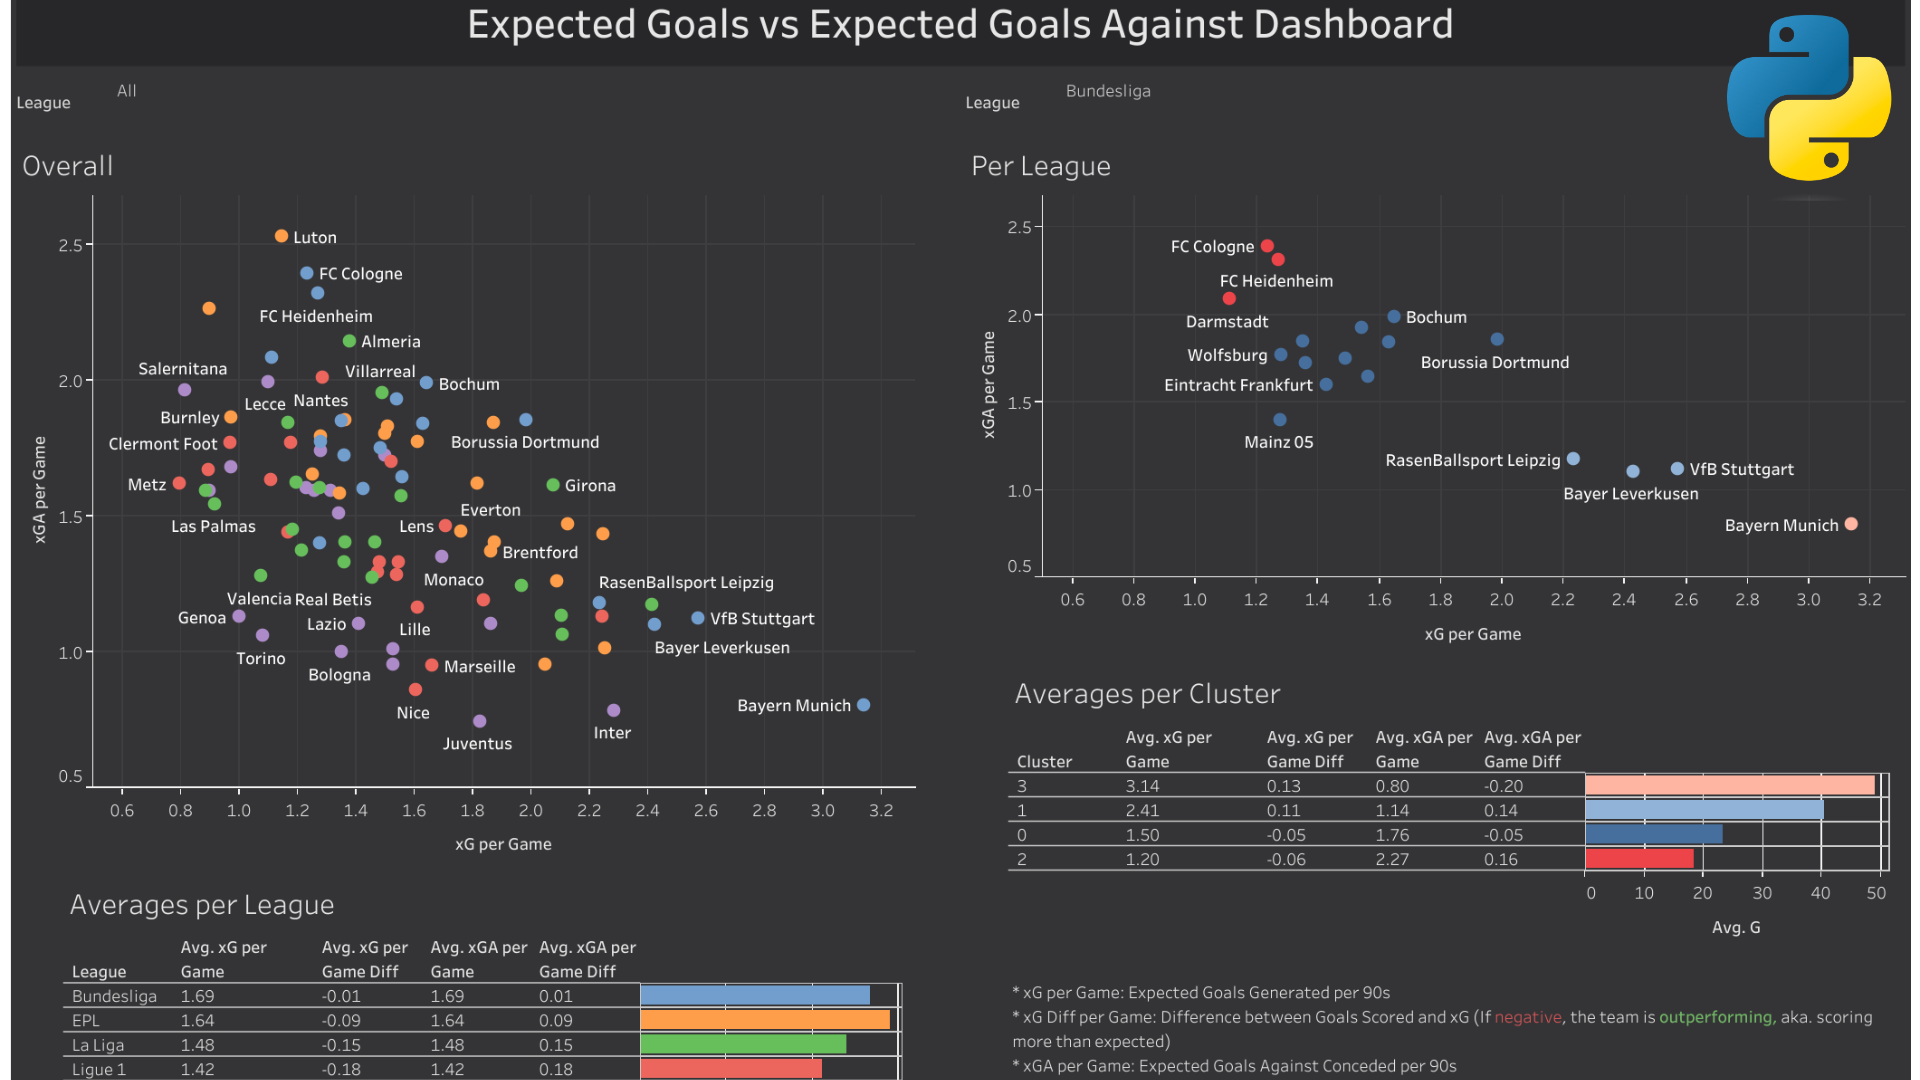
Hierarchical Clustering for TOP 5 Leagues Using xG and xGA
This project aims to categorize teams across the major five leagues by analyzing their Expected Goals (xG) versus Expected Goals Against (xGA) metrics. The goal is to identify similarities and connections between teams, offering insights into their statistical tendencies. By clustering teams, we seek to anticipate the expected statistical performance when two teams from different or similar clusters face off.
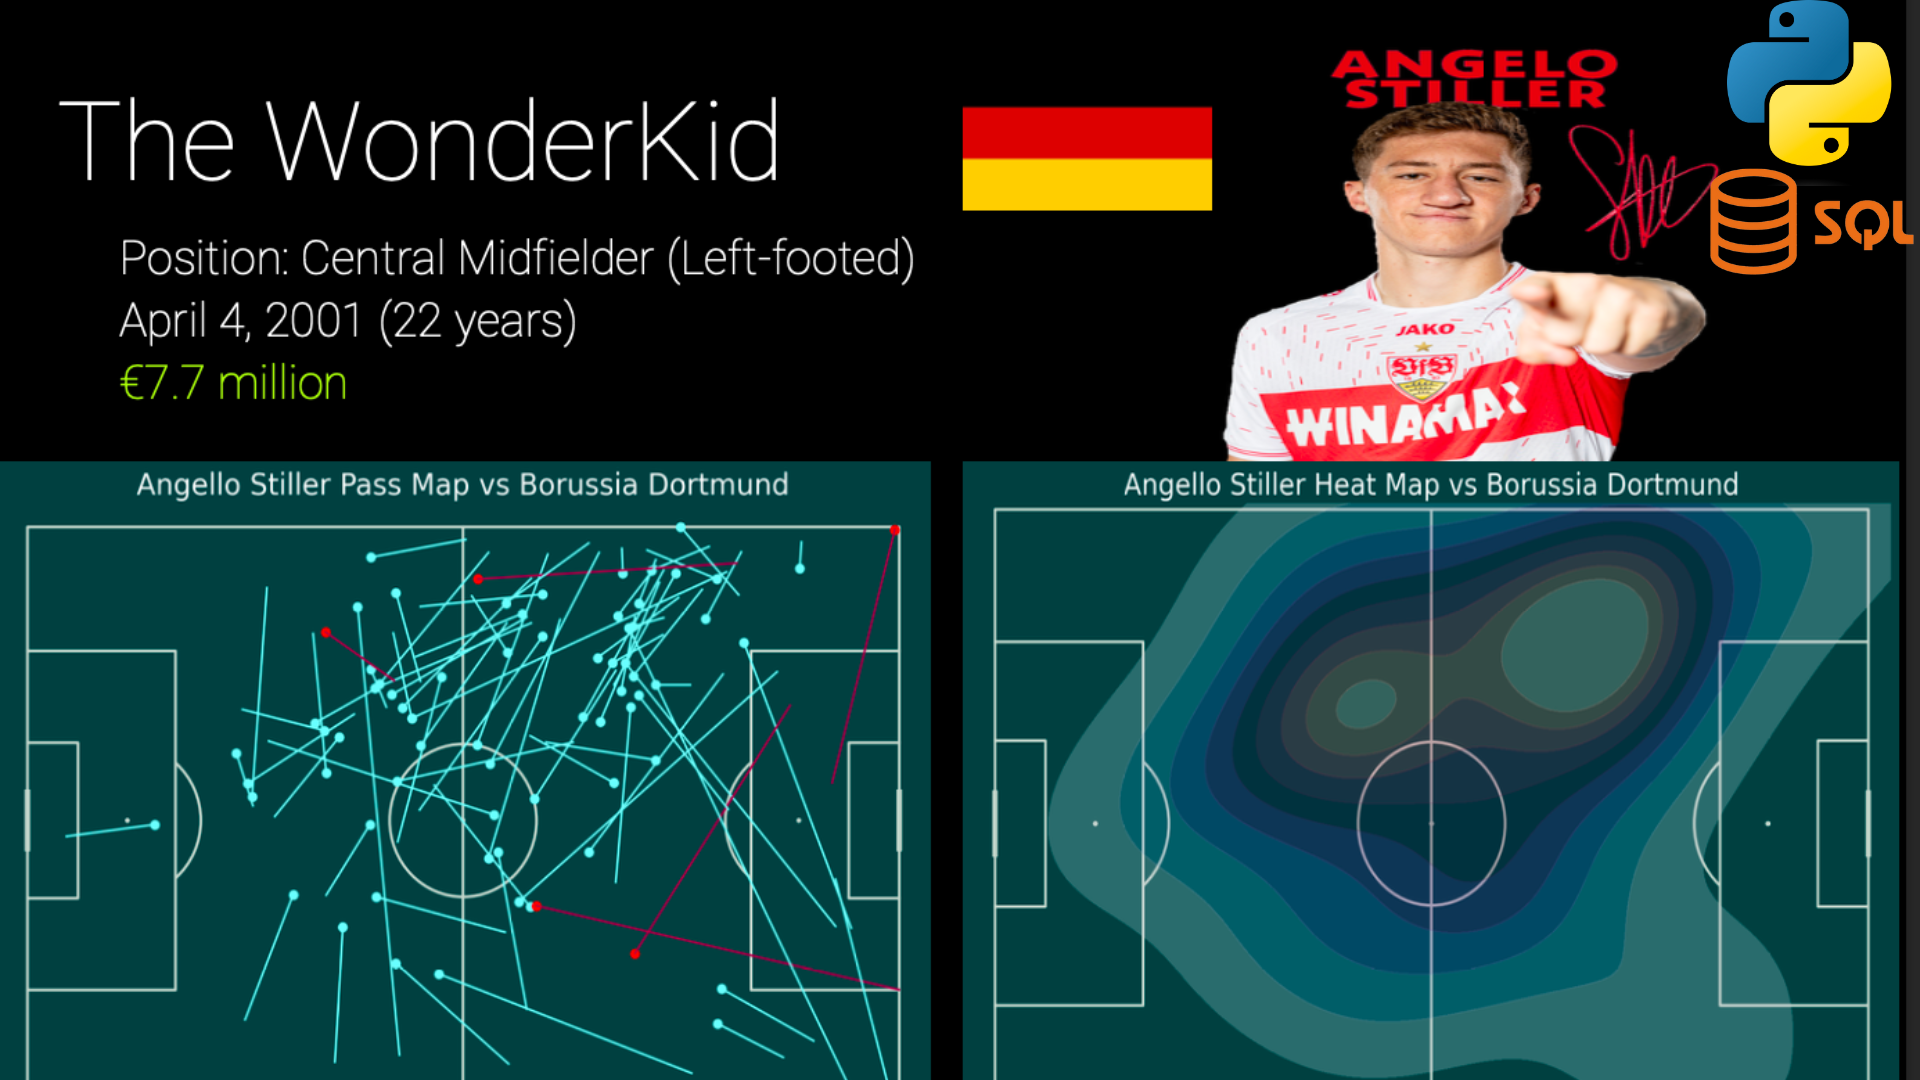
Cloud-Enabled Insights: Match Data Reports
This project collected football event data from Borussia Dortmund vs Stuttgart match in the Bundesliga using Python's BeautifulSoup library to scrape semi-structured JSON-formatted data from whoscored.com. The data was cleaned and transformed for accuracy. A cloud database instance was created using SQL and Python, integrating the structured data into Supabase.
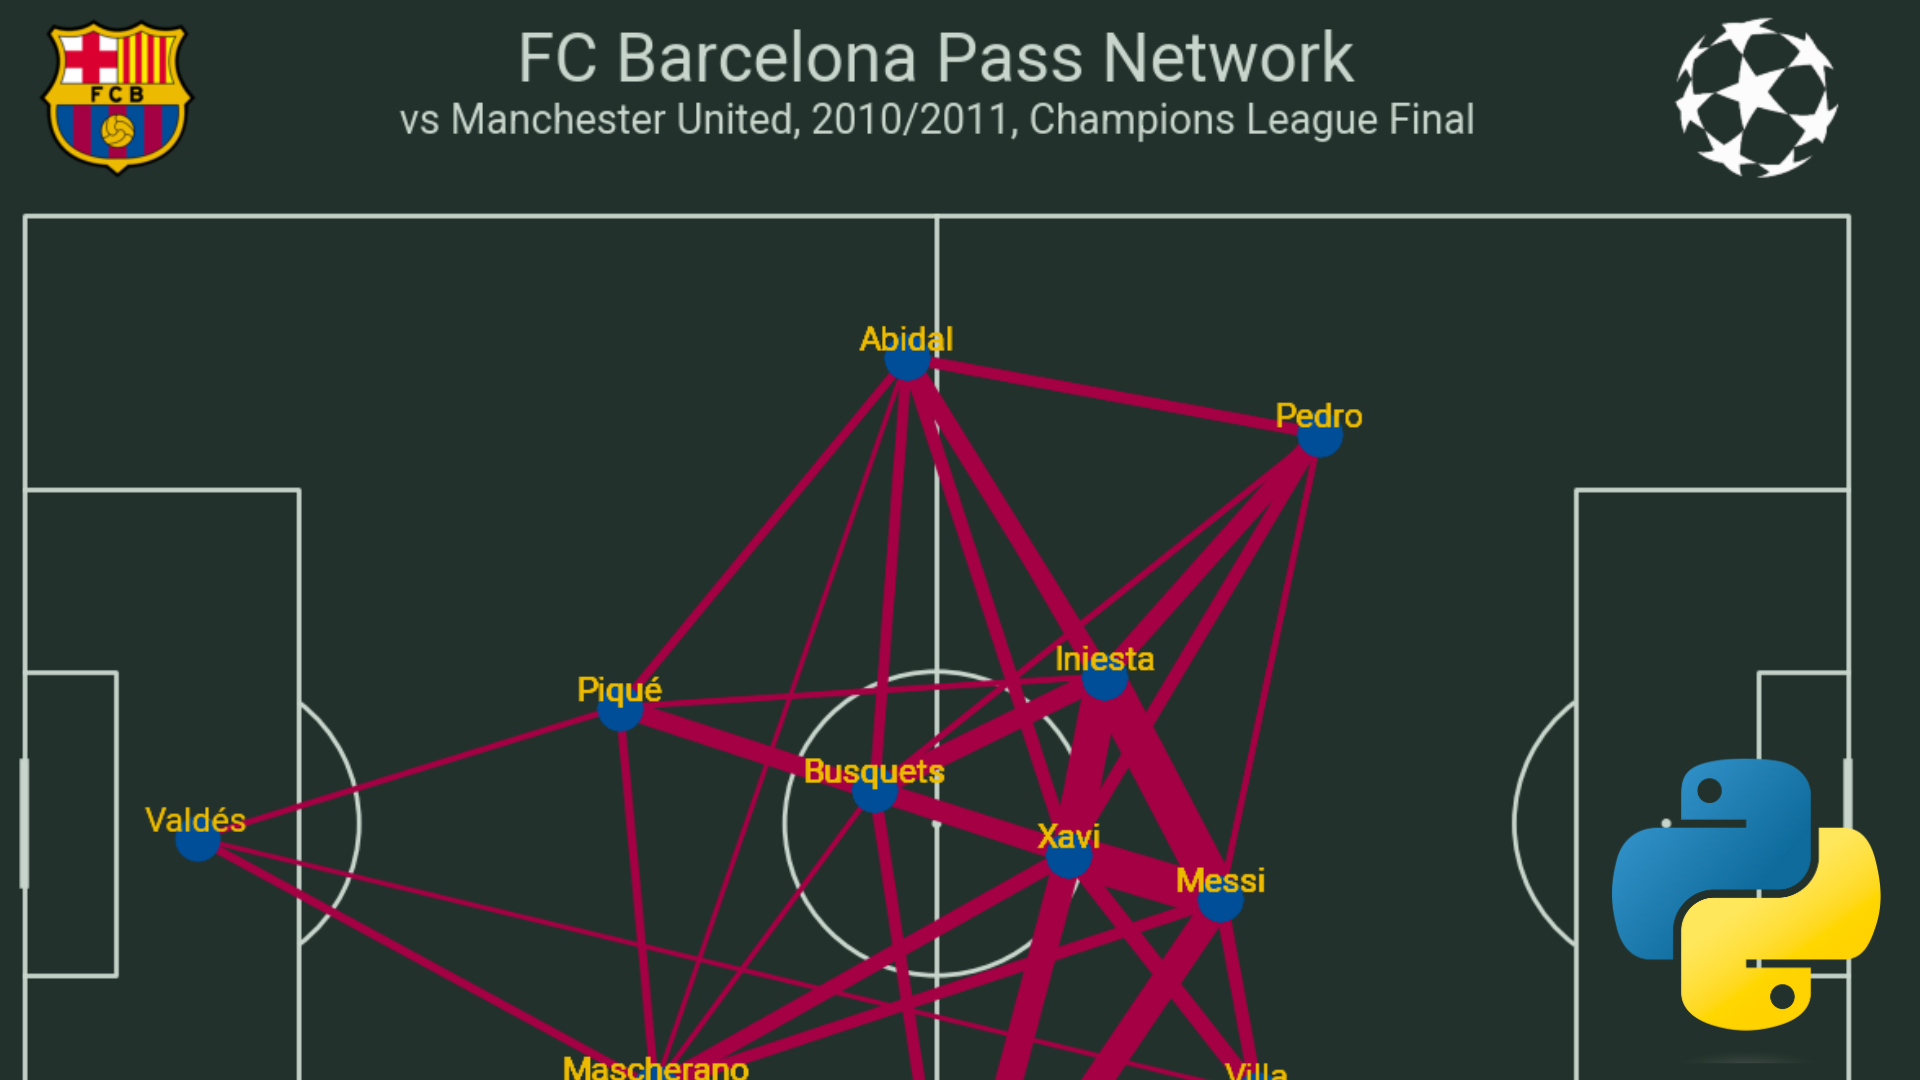
Unveiling Guardiola's FC Barcelona Passing Network Dynamics
Analyzed football event data from the Statsbombpy API, focusing on the UEFA Champions League Final 2011 match between FC Barcelona and Manchester United. Using mlpsoccer and matplotlib libraries, the project visualized FC Barcelona's passing network, creating a dynamic graph displaying player associations and their strengths through varying line thickness.
Predictive xG Betting Model
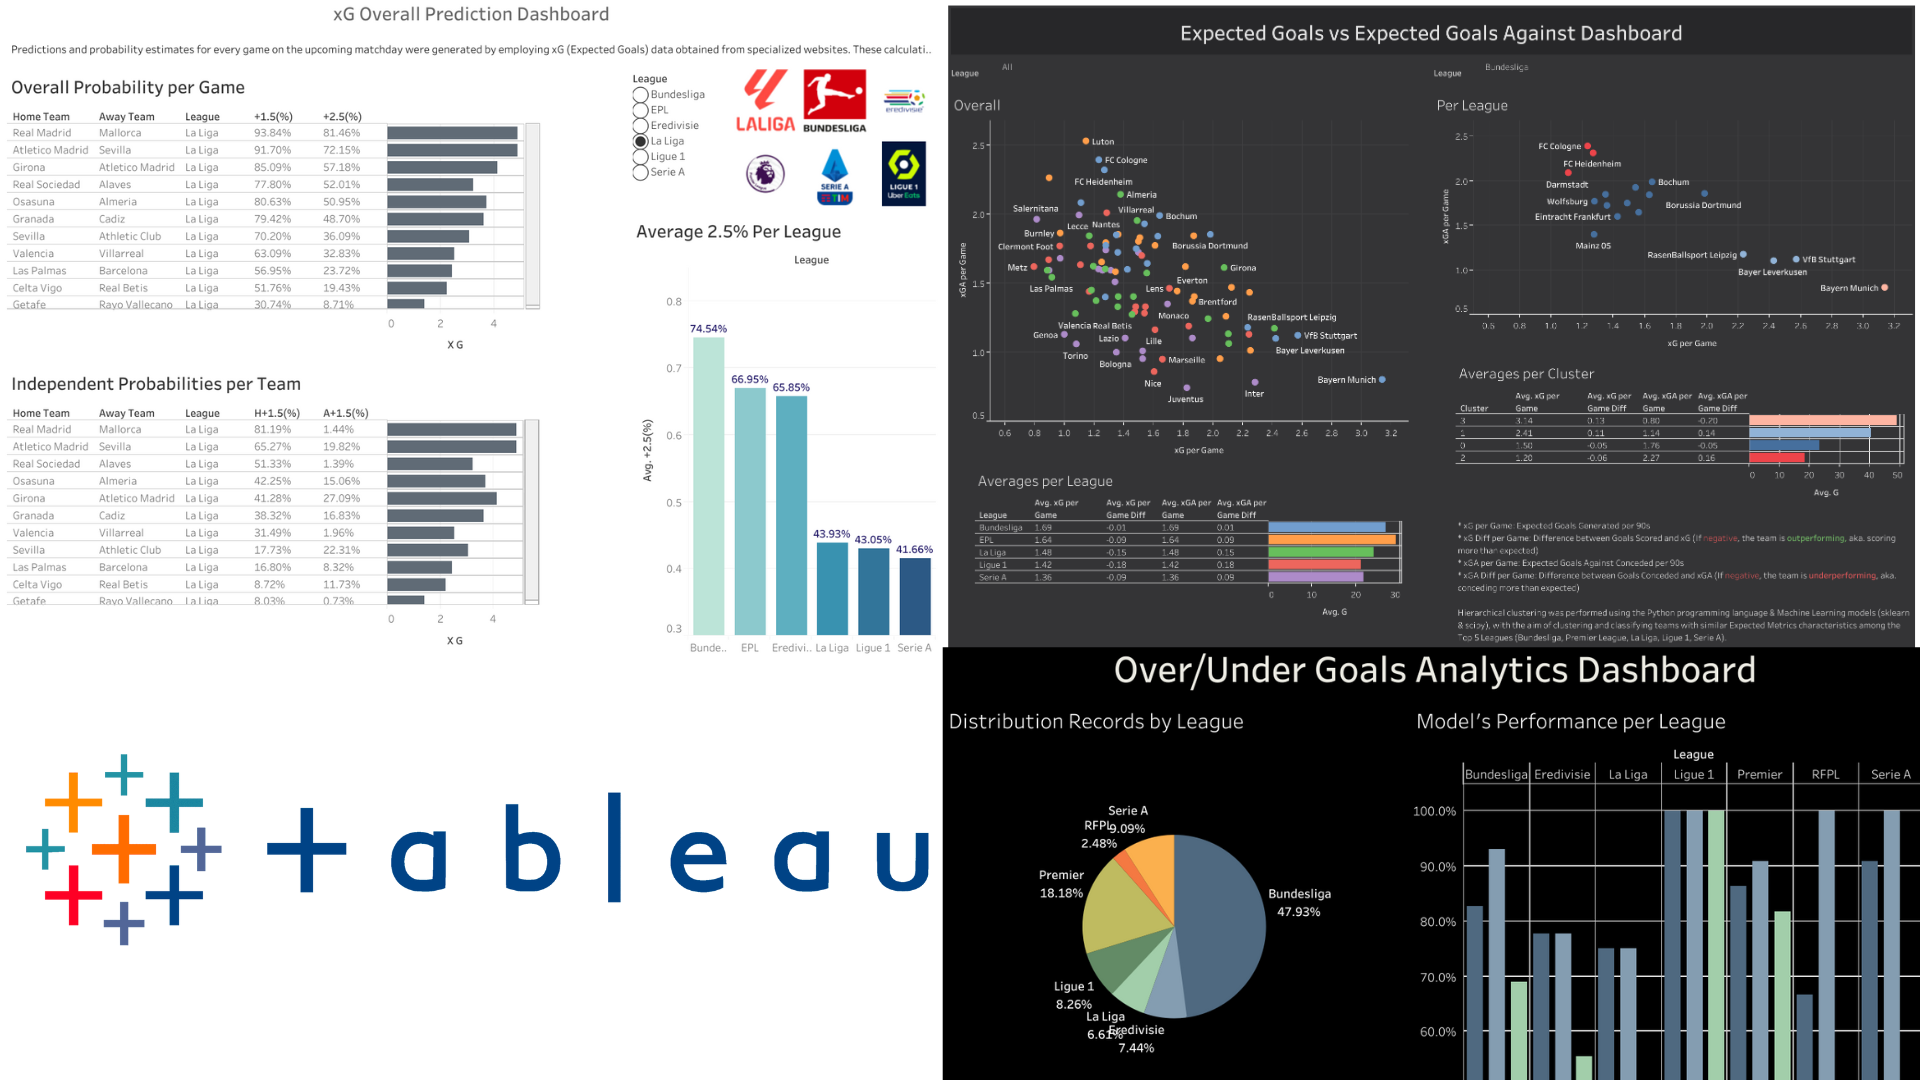
By harnessing web scraping techniques, this project collected detailed xG data from understat.com. Leveraging the power of the scipy library and the Poisson distribution, a sophisticated predictive model was crafted. This model not only estimates the likelihood of each game in the TOP 6 leagues having over 2.5 goals but also provides comprehensive predictions for various match outcomes. The project's scope encompasses API extraction and automation, ensuring a robust and comprehensive approach to data retrieval and predictive analysis in sports betting scenarios.
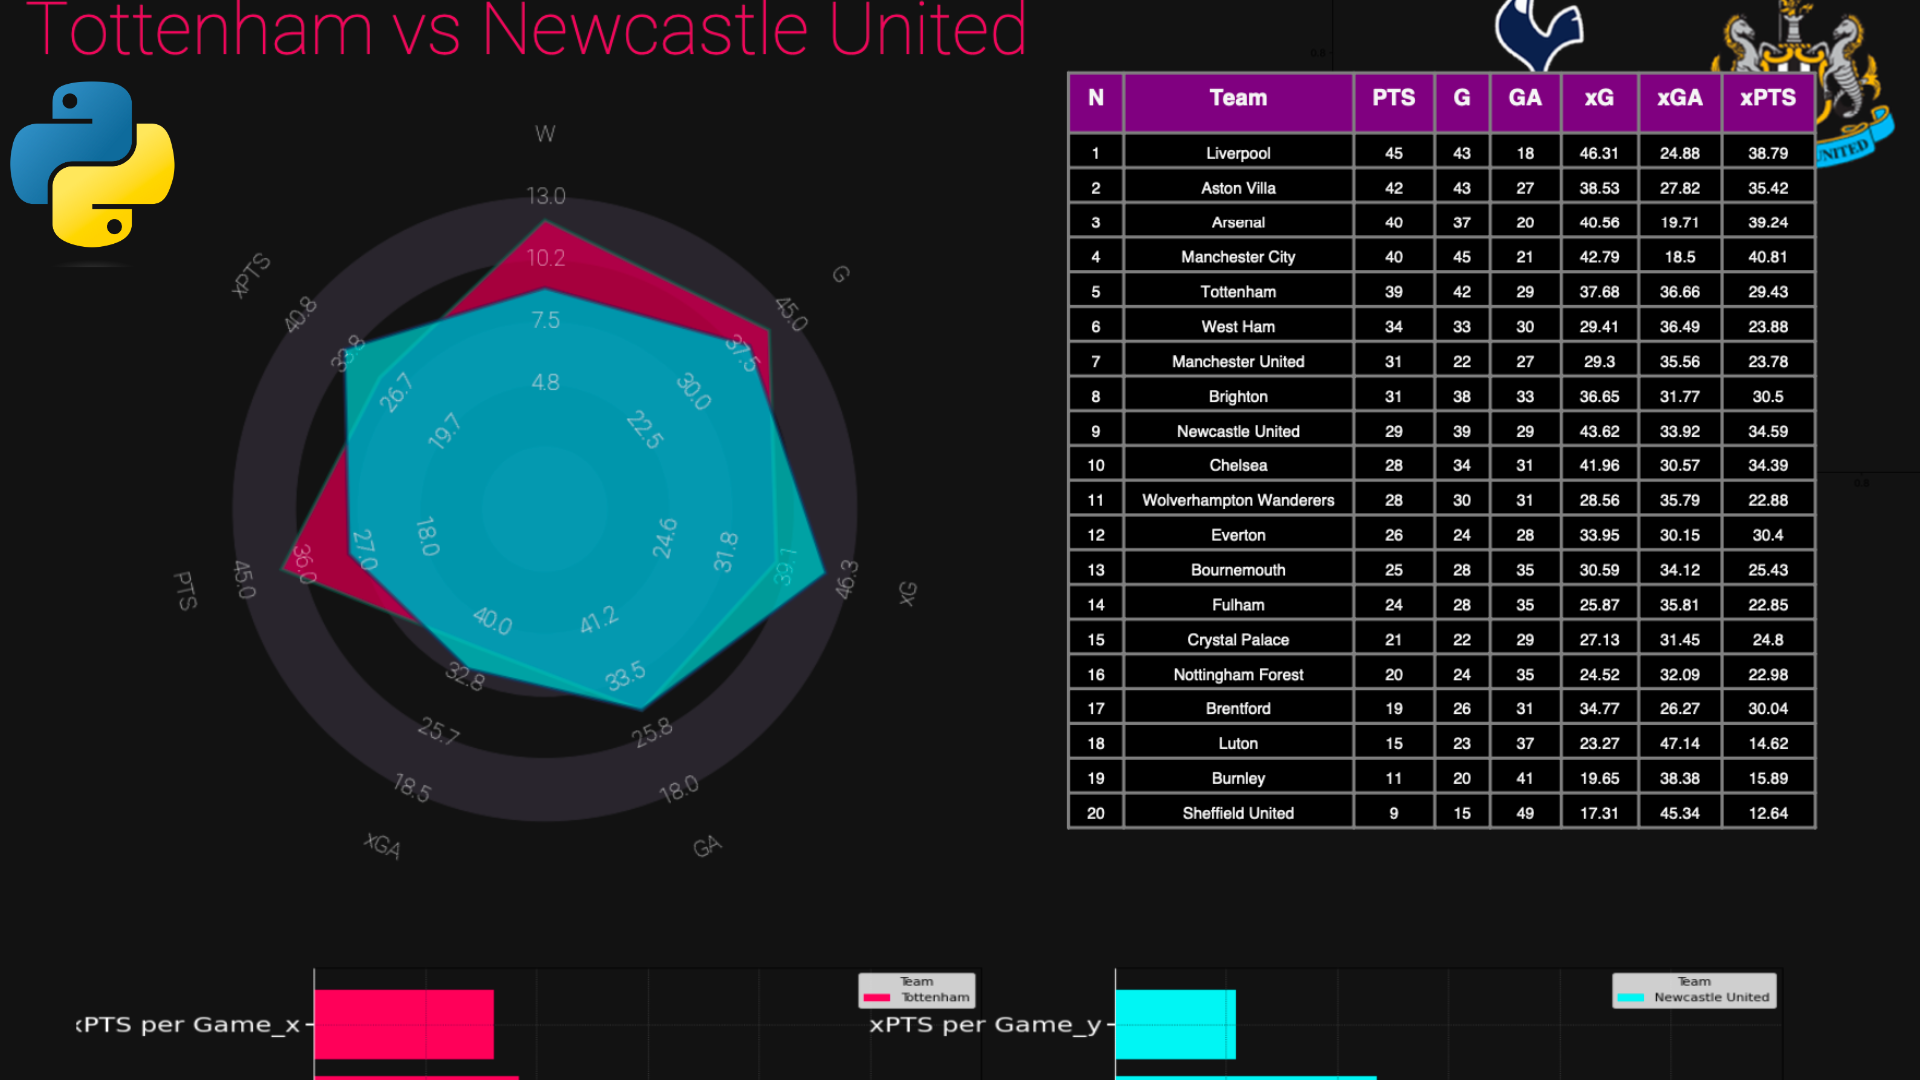
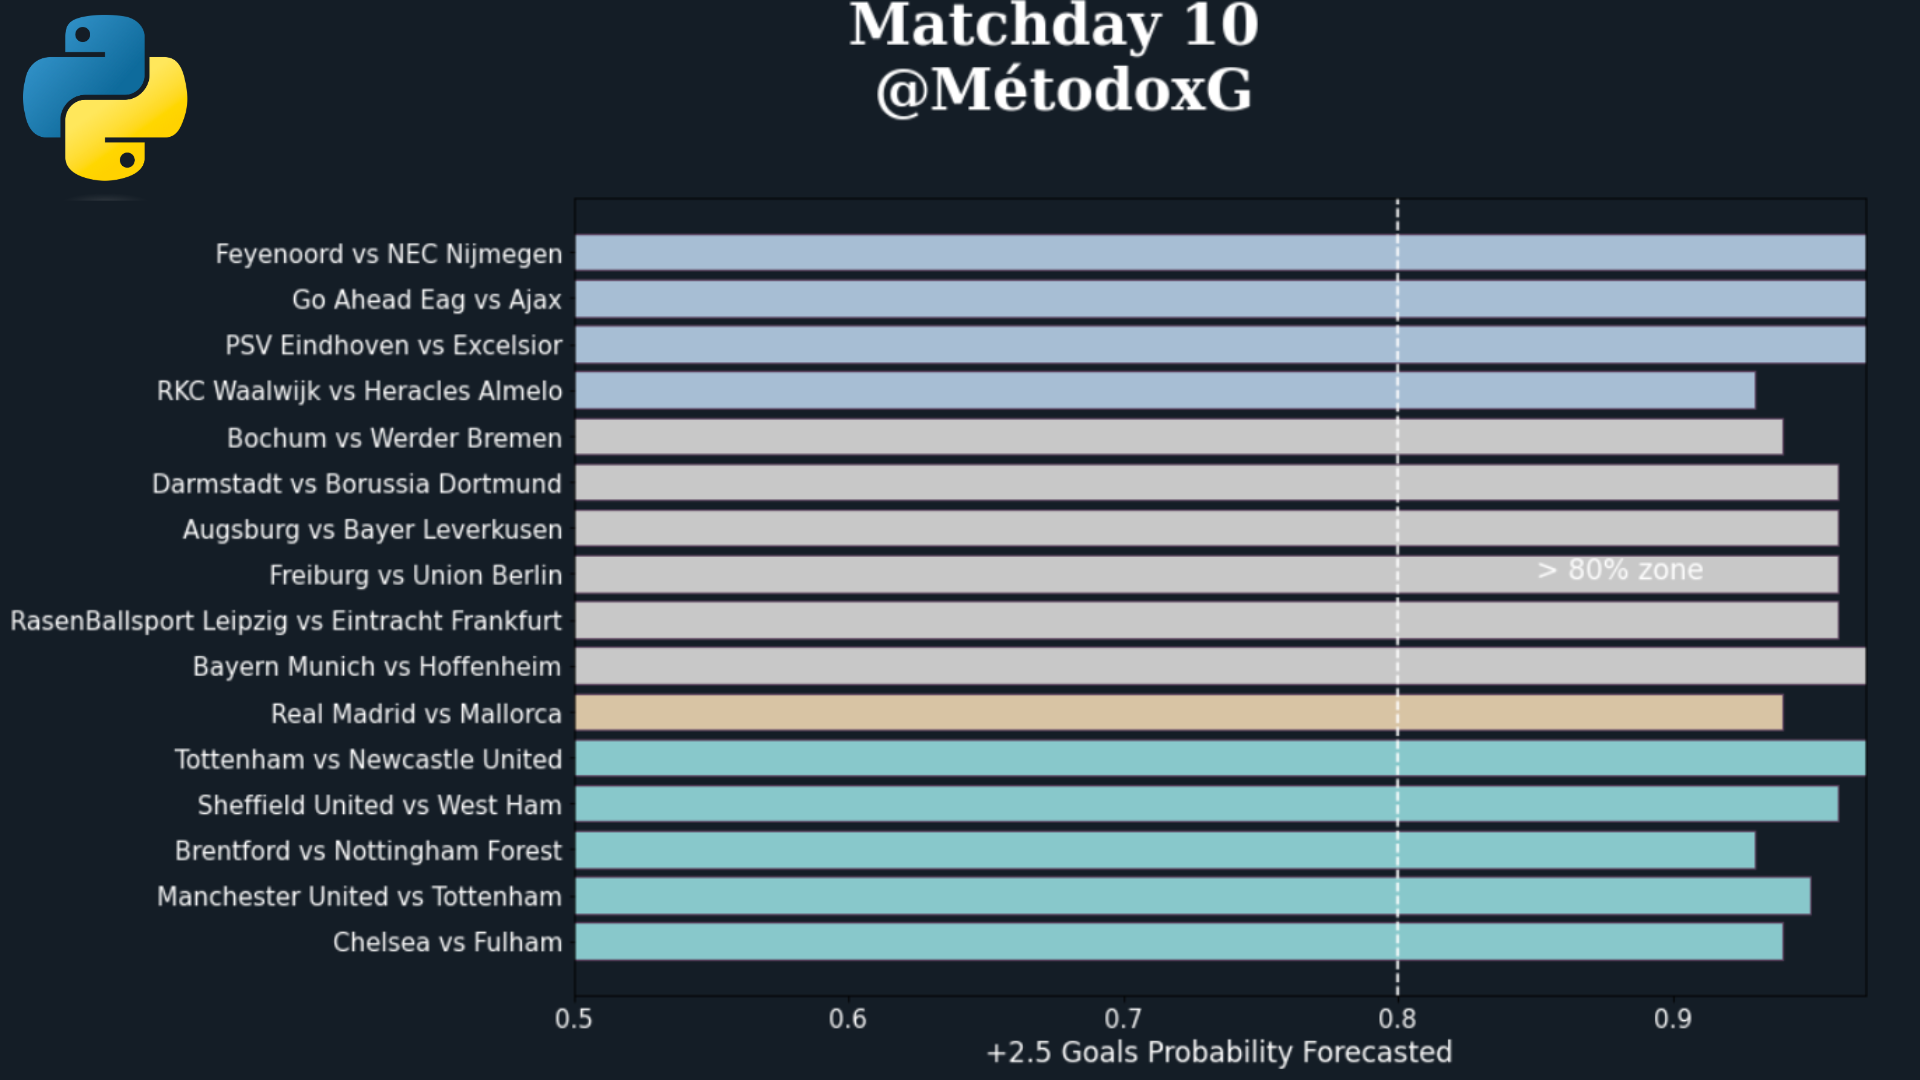
Automated Pre-Game Reports using Understat and Fotmob Data
This project automated the generation of PDF pre-game reports for upcoming matchweeks across the top 5 leagues. Utilizing stats scraped from understat.com and fotmob.com, the reports encompass advanced Expected Goals (xG) data, xG Difference, and xGA Difference. The system rapidly creates reports for all matches within a matchday, showcasing high scalability. These reports serve as inputs for intelligent pre-game analysis and betting strategies, offering quick insights into upcoming games.
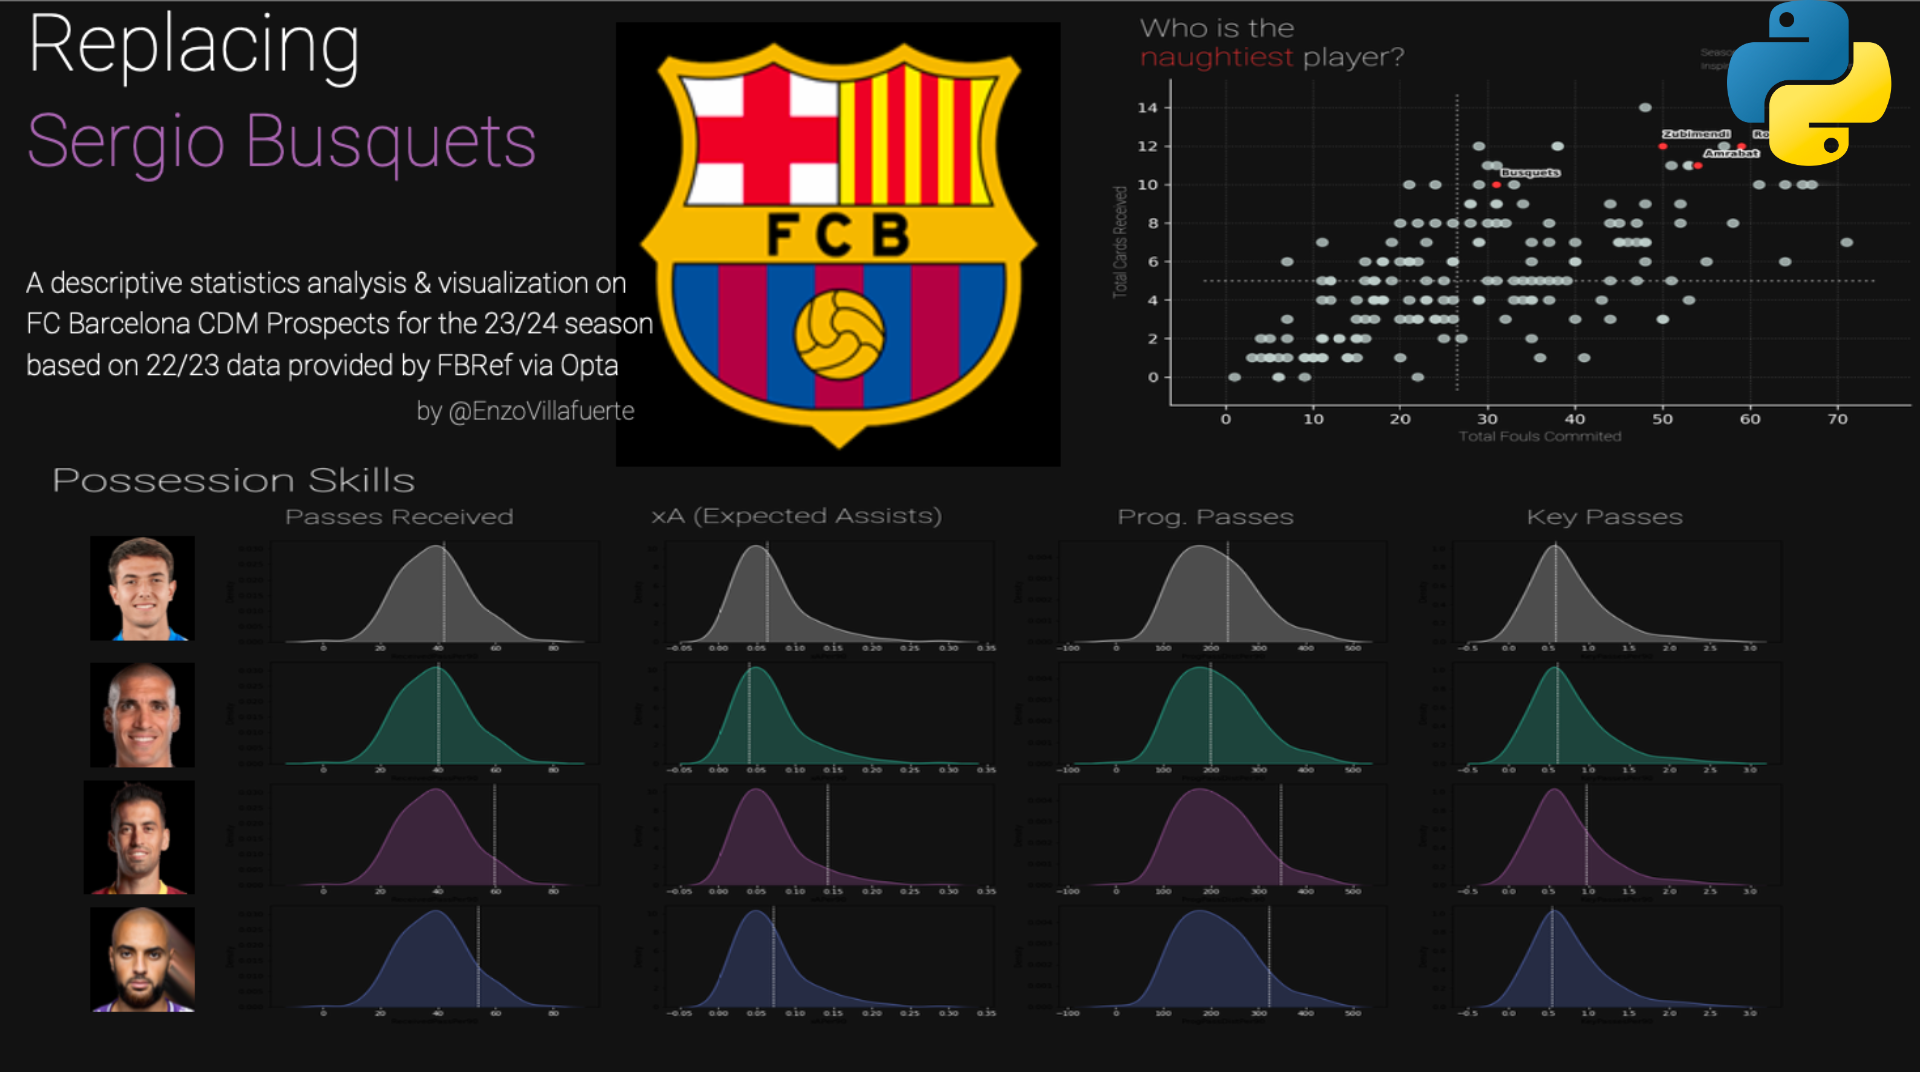
Prospect Prodigies: Identifying Future CDM for FC Barcelona
This project creates detailed scouting cards for four potential replacements for Sergio Busquets in FC Barcelona's critical Central Defensive Midfielder (CDM) position. It combines statistical analysis and precise data cleaning to produce comprehensive PDF reports. The process involves using statistical methodologies to assess players' CDM suitability and advanced web scraping from FBRef.com for football-specific data. These enriched scouting reports offer vital insights for informed decision-making in player scouting and recruitment strategies.
Past Projects
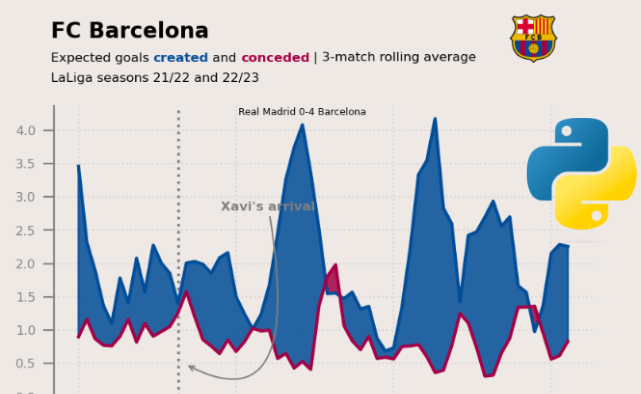
Rolling xG Plot: Analyzing FC Barcelona Performance
This project uses Python, Pandas, and Matplotlib to create a rolling plot of FC Barcelona's expected goals (xG) based on data from the 2021-2022 and 2022-2023 seasons, with the last game being Barcelona vs Cadiz at the Camp Nou. The plot includes a line that separates Xavi's numbers from Koeman's and showcases the team's xG performance over time.
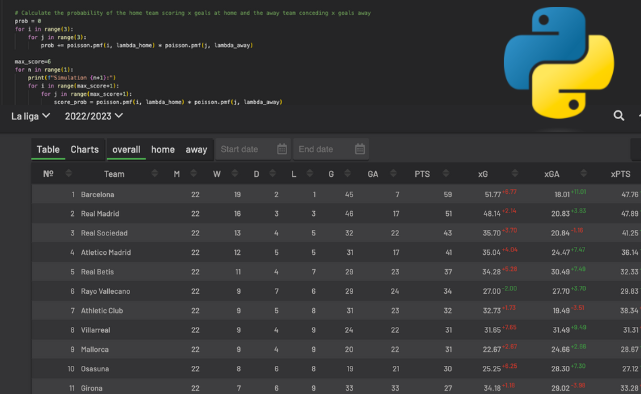
The xG/xGA Model: Predicting Over 2.5 Goals
This Model employs xG and xGA data, along with a Poisson distribution, to generate predictions on the likelihood of upcoming La Liga soccer matches having over 2.5 goals. The use of advanced statistical techniques allows for a more accurate assessment of goal-scoring potential, providing valuable insights for sports bettors and fans alike.
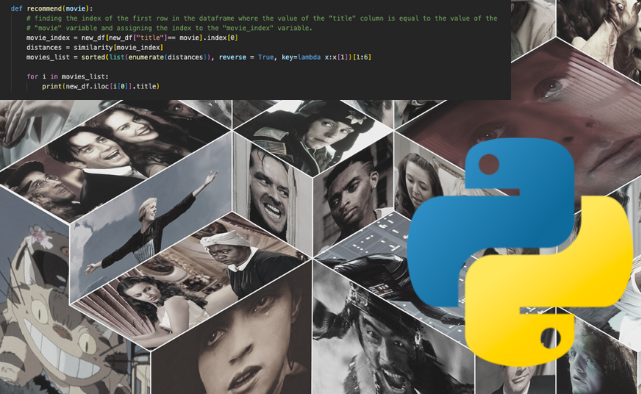
Movie Recommendation System
The user inputs a movie, and the program utilizes natural language toolkit and feature extraction to analyze patterns in the data. The program performs extensive data cleaning to ensure accurate recommendations. As a result, the program provides 5 movie recommendations that are similar in nature to the user's input movie.
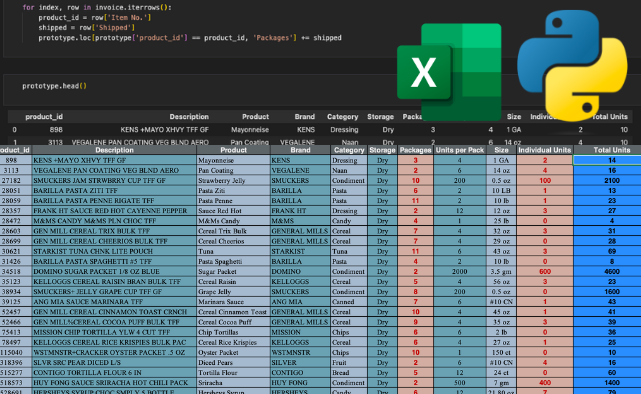
Automated Inventory Management System
Data pipeline that facilitates the tracking of inventory and updates it based on incoming data. The system leverages several software tools and technologies to perform these tasks, including Python, Pandas, and xlwings libraries, and a macro-enabled Excel workbook. The system can save time and reduce errors associated with manual data entry.
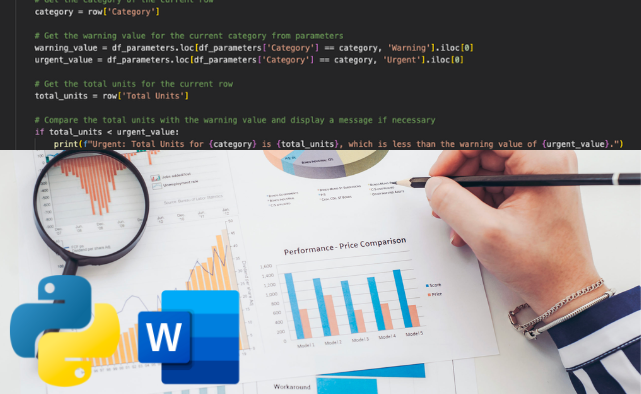
Automated Inventory Analysis Report
Program developed to automate the process of identifying products that are low in quantity. The program analyzes data from the inventory sheet, and based on pre-defined numerical parameters, outputs a report in Word format listing the products that fall below the specified thresholds. The program uses Pandas and the python-docx libraries.
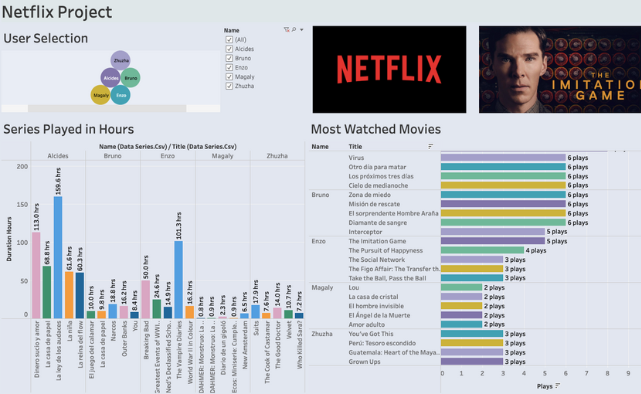
Netflix Data Analysis Project
The account data was requested from Netflix.com and a review was conducted on the trends and favorite movies/TV shows for each user. Prior to analyzing the data, extensive cleaning and manipulation were performed to ensure its accuracy and relevance, where users were defined by location or device type. Through this process, valuable insights were gained into the preferences of Netflix users and trends.
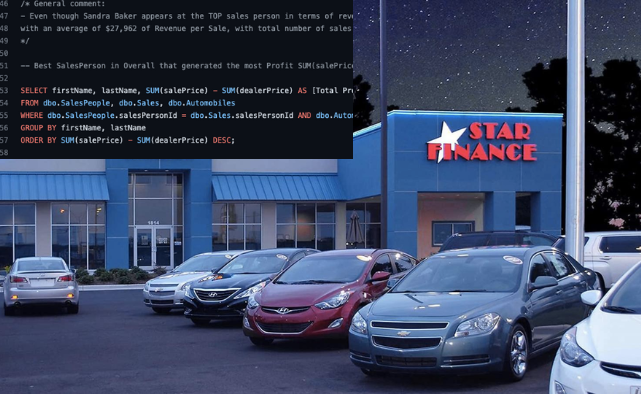
Car Dealership SQL Sales Data Exploration
This project aimed to leverage data querying and exploration techniques in SQL to uncover key insights from auto sales dealership data. The primary goal was to identify the most efficient salesperson within the dealership. To achieve this objective, a comprehensive analysis of the available data was conducted, focusing on various performance metrics.
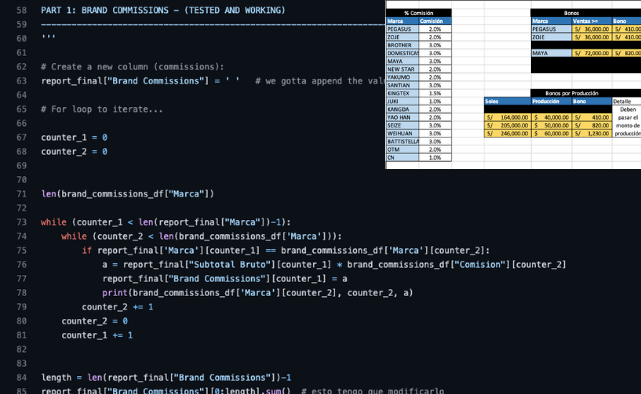
Commissions, Brand Bonus & Production Bonus Calculation System
Developed a Python-based automated system that calculates commissions, brand bonuses, and production bonuses for a Peruvian logistis & transportation company. The system uses input and parameters to provide accurate and efficient calculations, resulting in cost savings and increased productivity.
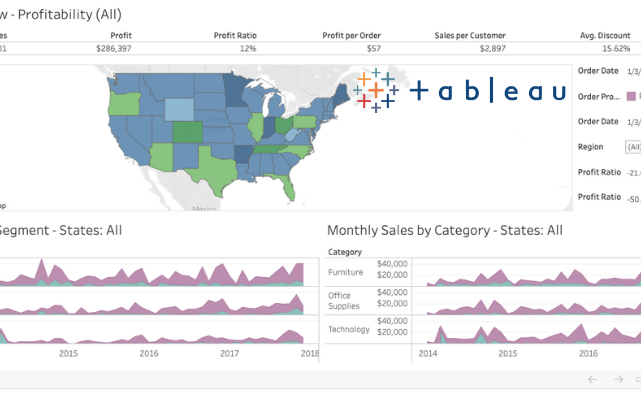
Tableau Dashboards
Through Tableau dashboards, we can gain a holistic view of various datasets, including COVID-19 project data from around the world and Latin America, sales data from stores, Netflix account data, industry consumer data (such as movie preferences and pet ownership), and more. Additionally, we can also incorporate football data, such as the World Cup and La Liga matches, to gain valuable insights into the sport.

S. Peña Statistical Report
Delve into the analysis of Sergio Peña's performance during the 20-21 season in the Dutch first division. The analysis highlihts the importance of the correct interpretation of machine & deep learning advanced metrics and models. The study contains descriptive and predictive analysis.
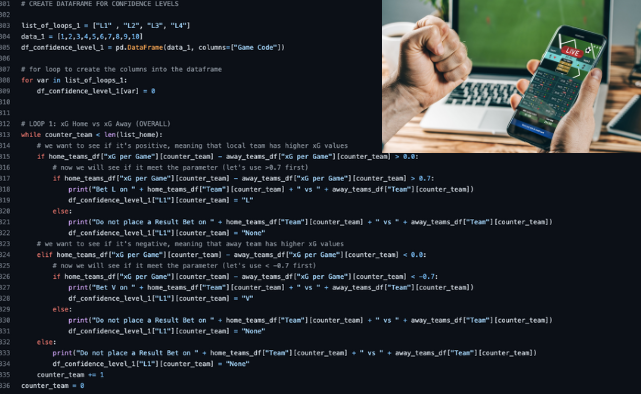
xG and xGA Betting Model
Python program designed to provide support in Soccer betting strategies. It analyzes the statistics of the different teams and outputs a betting recommendation based on parameters and conditions for each game. A great portion of it involves Data Cleaning and Manipulation.
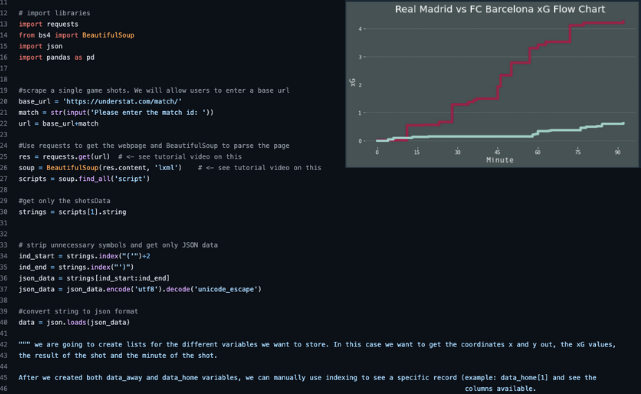
Understat Web Scrapping Project
In this project the "Real Madrid vs FC Barcelona - Season 2021-2022" game data is extracted from understat.com leveraging Beautiful Soup's web scrapping capabilities to later use the data to create a visualization (xG FlowChart) .

Expected Goals Barca Descriptive Analysis
xG data & performance analysis of FC Barcelona under Xavi is analyzed and compared to the club's stats under the previous manager: Ronald Koeman.
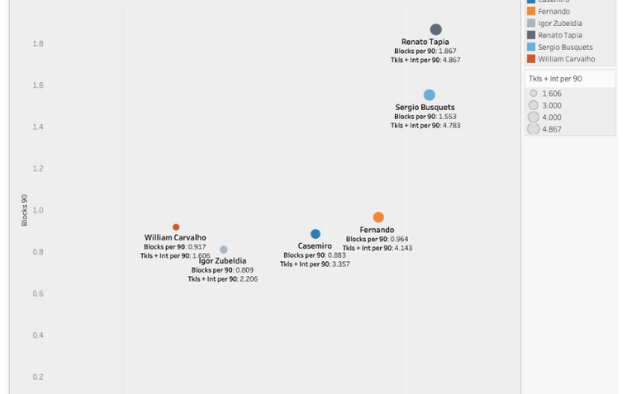
Renato Tapia Defensive Analysis
Project that analyzes Tackles, Interceptions and Blocks of Renato Tapia's defensive performance and compare them against TOP defensive midfielders in La Liga 20-21 .
Calories & Macros Fitness Tracking System
Outputs the total Calories needed for the goal (i.e. Caloric Surplus), along with the amount of macronutrients needed per day, based on the Total Energetic Expenditure.